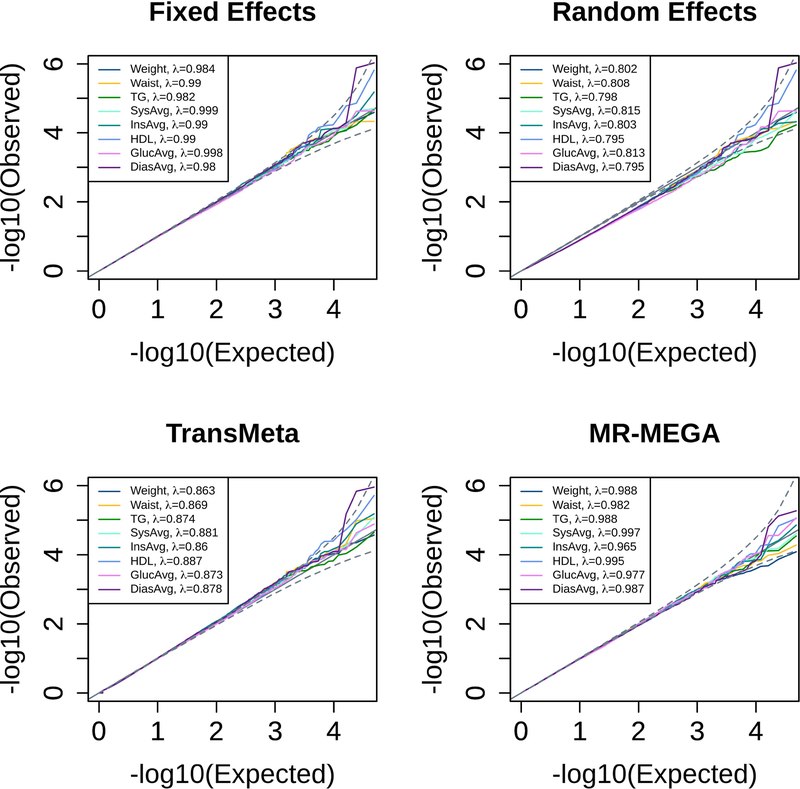
Figure 1:
QQplots of −log10(p − value) for FE, RE, TransMeta, and MR-MEGA meta-analysis methods. The expected line is shown in black and confidence bands are shown in dashed black lines. All 8 phenotypes used are shown using different colored lines (legend). QQplots were generated using a genome-wide LD pruned set of 48,624 SNPs.

