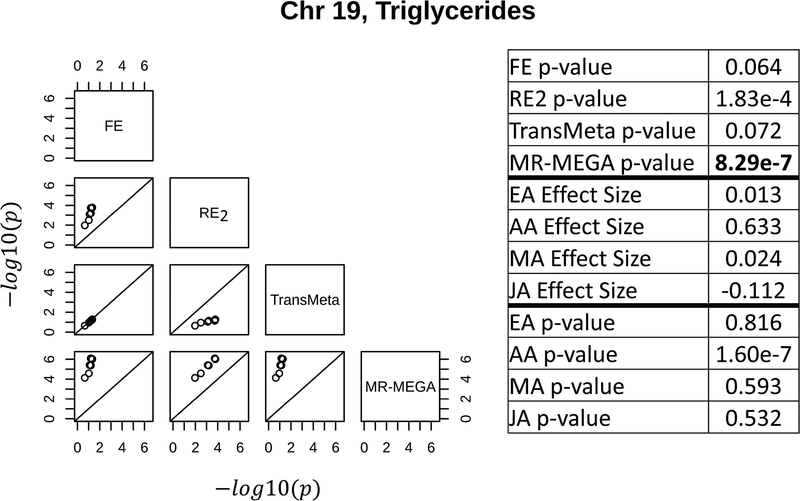
Figure 4:
The left figure shows pairwise scatterplots of the −log10(p − value) for all SNPs with p – value ≤ 1e − 4 by at least one meta-analysis method for a locus at 38,030,933 – 38,097,313 bp on chromosome 19 associated with triglycerides (14 SNPs total). MR-MEGA is better able to detect the locus at the suggestive threshold of 1e-6 than TransMeta. The right table shows the summary statistics (effect sizes and p-values) from each ethnic group for the SNP with the lowest p-value by any of the four meta-analysis methods. The meta-analysis p-values for each method are also shown for this leading SNP, with the lowest meta-analysis p-value (by MR-MEGA) in bold. Base pair coordinates are in Build 37. See Supplemental Figure S2 and Supplemental Table D.1 for more information about this locus.

