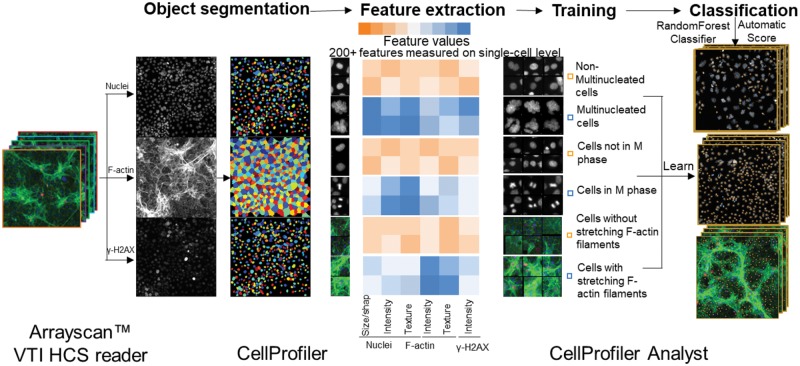
Figure 1.
Machine learning-based high-content and phenotypic analysis in the testicular cell co-culture. The diagram illustrates the 4 steps of the ML process. First, object identification and segmentation were conducted on multi-channel images (nuclei, cytoskeleton, and γ-H2AX) using CellProfiler. Second, these quantified data, along with the images, were imported into the CellProfiler Analyst and a supervised ML was performed via the “Random Forest Classifier” algorithm (Broad Institute; Breiman, 2001; Jones, et al., 2008). The supervised training with specific phenotypes, including cytoskeletal changes, multi-nucleation, and mitosis was conducted until the values of positive and negative recognition for each phenotype reached 99% and 0.01%, respectively. Finally, these classification rules inferred from the training-set were applied to score all cells in the experiment.

