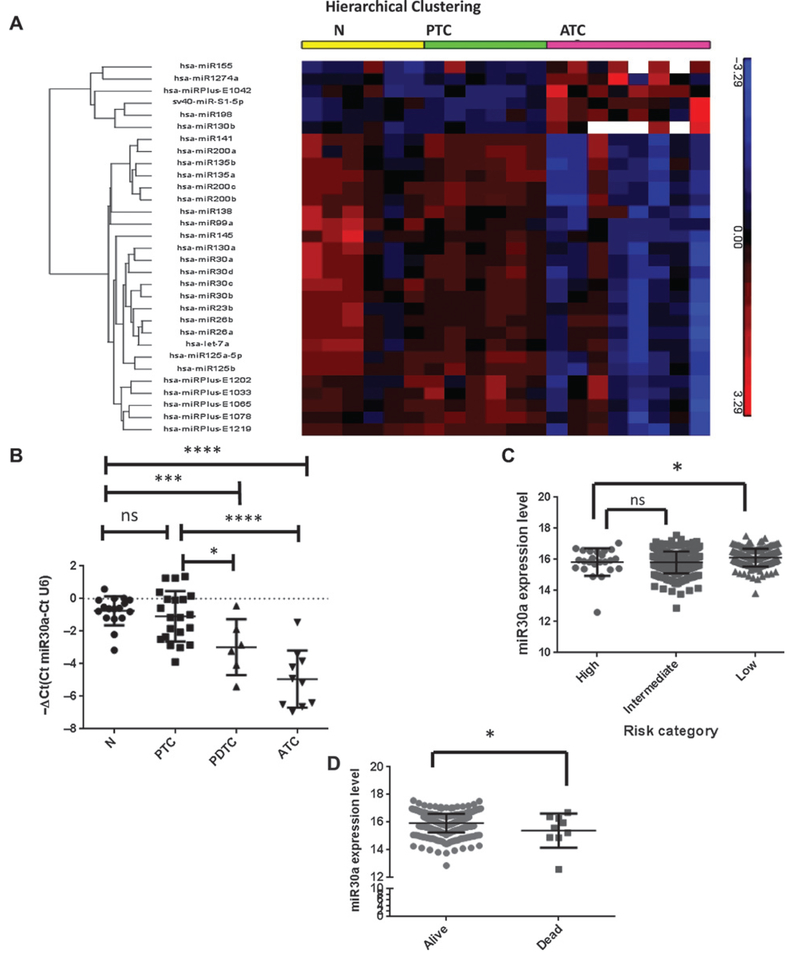
Figure 1.
miR30a expression in thyroid tissue. A, heatmap of differentially expressed miRNA in thyroid cancer samples. Supervised hierarchical clustering of miRNA expression in 20 tissue samples: 6 N, 6 PTC, and 8 ATC. Red, overexpression; green, underexpression. N, normal. B, miR30a expression is downregulated in the aggressive thyroid cancer PDTC:17N, 21 PTC, 10 ATC, and 6 PDTC samples were analyzed. *, P < 0.05; ***, P< 0.001; ****, P < 0.0001. C, miR30a expression by thyroid cancer risk group as defined by the MACIS prognostic scoring system. Data from NCI’s TCGA program (accessed at explorer.cancerregulome.org) showed significantly lower expression of miR30a in high-risk thyroid cancer, as defined by the MACIS risk group. *, P < 0.05; ns, not significant. D, miR30a expression is lower in patients who died from conventional PTC. *, P < 0.05.

