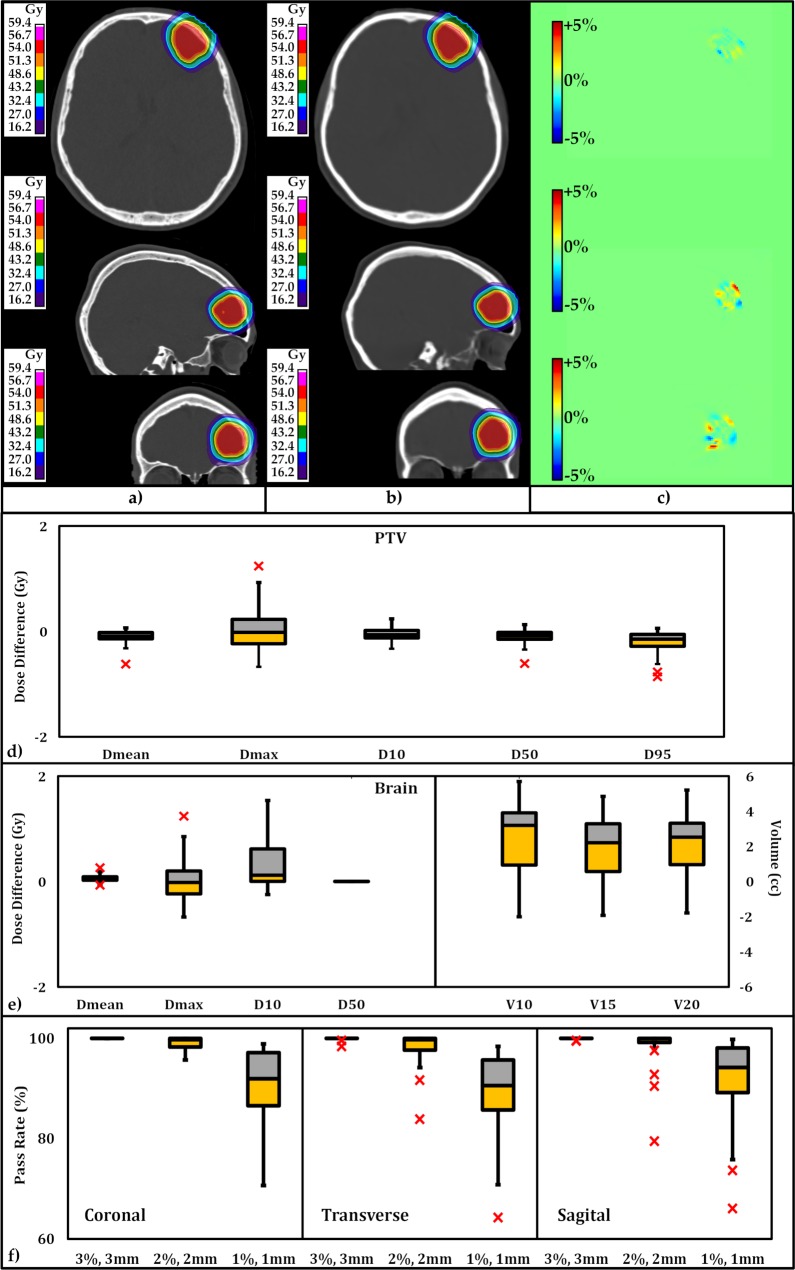
Figure 3.
Transverse, sagittal, and coronal views of (a) dose distribution based on planning computed tomography, (b) dose distribution based on synthetic computed tomography, and (c) dose distribution difference. The statistical distribution of absolute dose distribution difference at dose-volume histogram endpoints for (d) planning target volumes and (e) organs-at-risk (brain) for all 25 plans In the study cohort. The central mark indicates the median. The yellow and gray bars indicate the second and third quartile. (f) The statistical distribution of the pass-rate results of the γ-index analyses along the coronal, transverse, and sagittal planes are within 3 distinct criteria (3% and 3 mm; 2% and 2 mm; and 1% and 1 mm).

