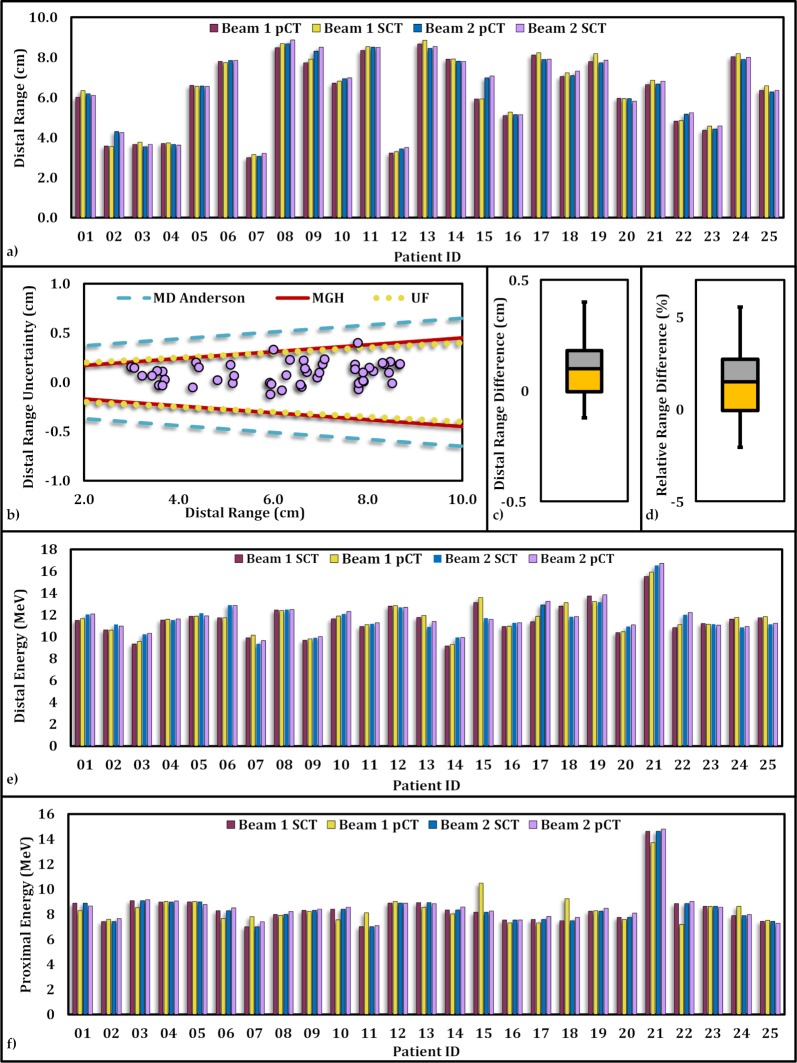
Figure 4.
Proton distal range comparison along the direction of each beam calculated based on planning computed tomography (pCT) and synthetic computed tomography (SCT) for the study cohort. (a) The beam range corresponding to each beam for each patient in the study cohort based on pCT and SCT. (b) Proton distal range differences along each beam are depicted in purple circles. Solid red, dotted yellow, and dashed blue represent the criteria adopted from Massachusetts General Hospital, the University of Florida, and MD Anderson and the University of Pennsylvania, respectively. (c) The statistical distribution of differences in proton distal range calculated based on pCT and SCT along each beam. (d) The statistical distribution of relative distal range differences. Distal (e) and proximal (f) energies obtained from SCT and pCT along each beam for each patient.

