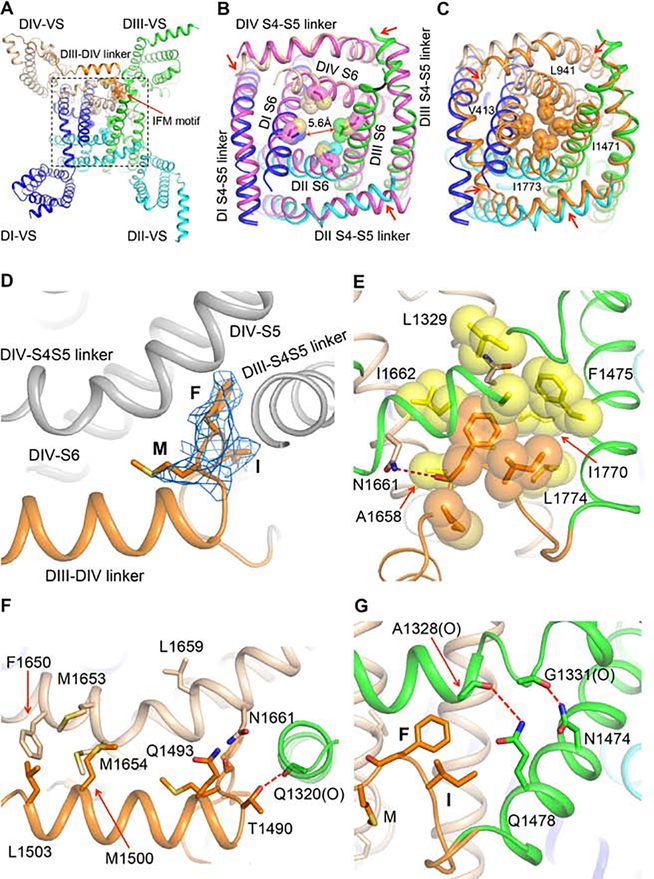
Figure 5. Activation and Fast Inactivation Gates.
(A) Bottom view of the rNaV1.5C intracellular activation gate. The IFM motif (Ile1485-Phe1486-Met1487) and the sidechains of amino acid residues that partially close the activation gate are shown in sticks with half-transparent van der Waals surface.
(B) Close-up view of the rNaV1.5C intracellular activation gate aligned with the open-state structure of NavAb-Δ40 (PDB code: 5VB8) colored in magenta.
(C) Close-up view of the NaV1.5C intracellular activation gate aligned with the resting state model of rNaV1.5C activation gate calculated by MODELLER based on the resting state structure of NavAb (PDB code: 6P6W). The resting model is colored in orange with key residues sealing the activation gate shown in sticks and half-transparent van der Waals surface.
(D) Side view of the IFM motif shown in sticks with electron density mesh contoured at 3 σ.
(E) Close-up view of IFM motif bound to the hydrophobic pocket shown in yellow. Dotted line in red, hydrogen bond.
(F) Interaction of DIII-DIV linker with DIII and DIV S4-S5 linker. “(O)” indicates an important interaction with a backbone carbonyl group. Dotted line in red, hydrogen bond.
(G) Interaction of DIII S6 with DIII S4-S5 linker. “(O)” indicates an important interaction with a backbone carbonyl group. Dotted lines in red, hydrogen bonds.

