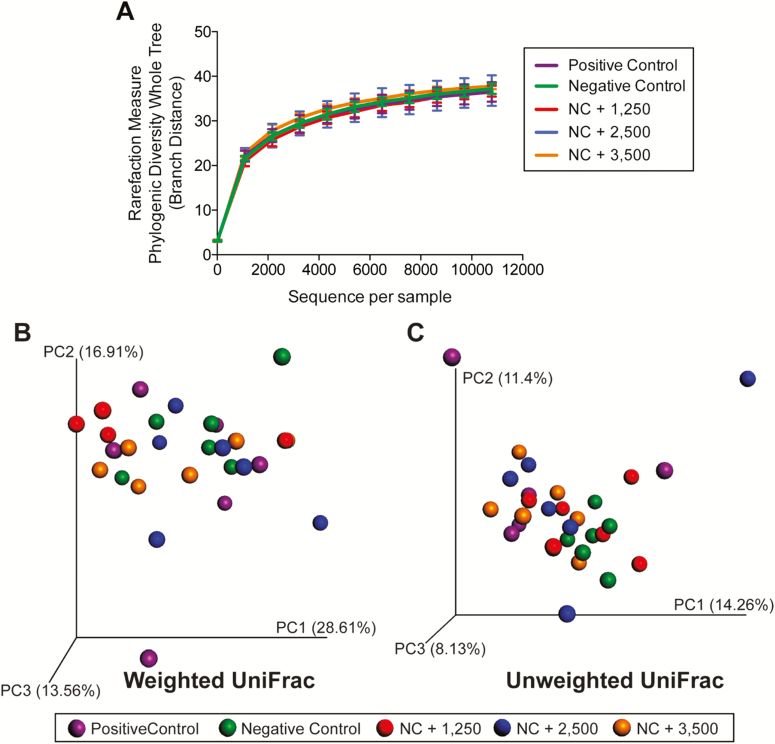
Figure 4.
Rarefaction curves (A) and principal coordinates analysis (PCoA) plots of weighted (B) and unweighted (C) UniFrac distances of colonic microbial communities from weanling pigs fed diets containing antibiotics or direct-fed microbials. Diversity measures and unweighted and weighted UniFrac distances performed on the 97% OTU abundance matrix were not different among treatments.

