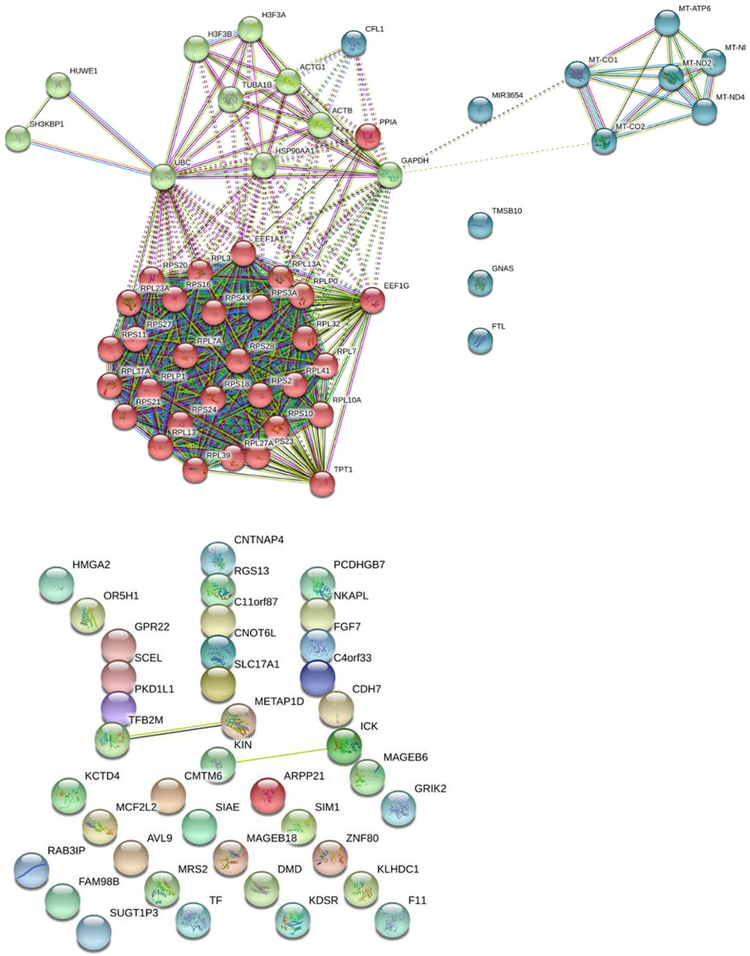
Fig. 2. A map of functional interactions (interactome) of KISS1 with various.
brain metastatic cellular proteins. Previously reported interactions are shown by solid lines, whereas potential or predicted interactions are indicated by dashed lines. Subnetworks of upregulated (top) KISS1-interacting proteins (with expression profiles directly correlating with that of KISS1) are presented by 3 distinct cohorts grouped by color, each representing protein networks implicated in the following cellular functions: mechanisms of protein synthesis (red spheres), cellular metabolism involving mitochondrial proteins (green spheres), and cellular invasion mechanism (blue spheres). Downregulated proteins with expression profiles inversely correlating with that of KISS1 (bottom) do not fall into any distinct functional (color-grouped) cohorts and also exhibit a very few experimentally-evidenced/established functional links.

