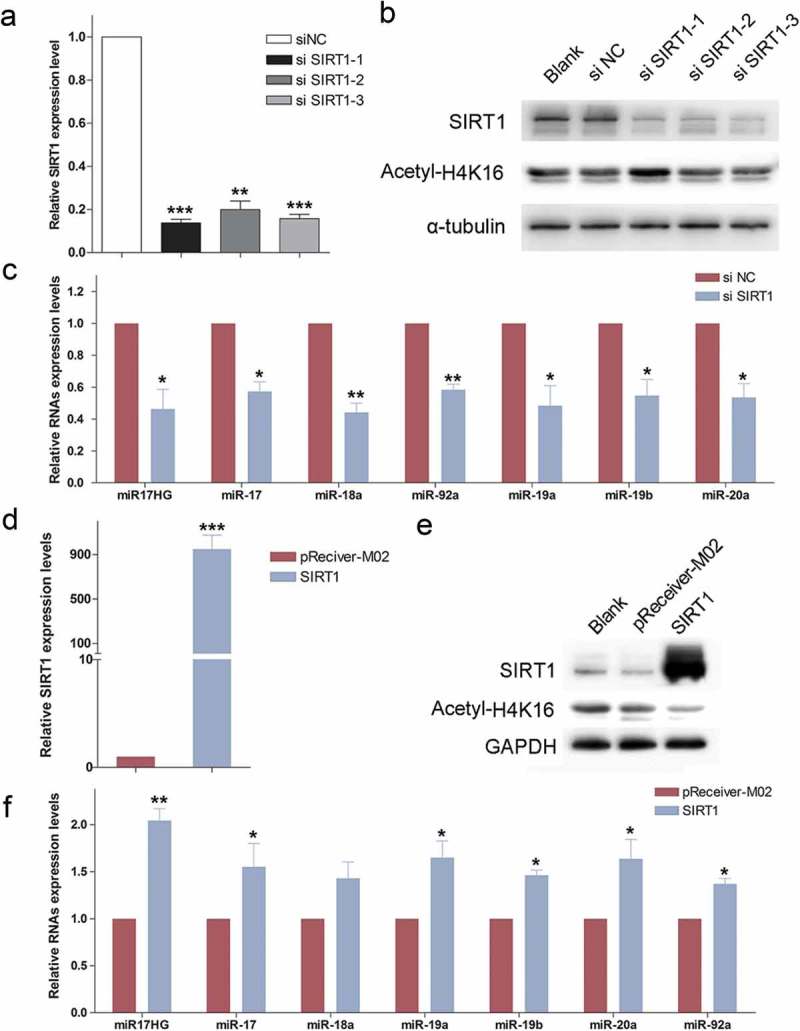
Figure 1.

The expression of miR17HG was positively correlated with SIRT1. (a) Real-time qPCR was used to detect the expression levels of SIRT1 mRNA in 293 cells transfected with siNC or siSIRT1-1/2/3. Columns, mean of at least three independent experiments; bars, SEM. **, P< 0.01; ***, P < 0.001, comparison between two groups as indicated. (b) Western blot was performed to monitor the expression levels of SIRT1 and Acetyl-H4K16 in cells transfected with siNC or siSIRT1-1/2/3. (c) Expression of miR17HG and miR-17–92 miRNAs in siNC or siSIRT1 transfected cells. Columns, mean of at least three independent experiments; bars, SEM. *, P < 0.05; **, P< 0.01, comparison between two groups as indicated. (d) Expression of SIRT1 in pReceiver-M02 or SIRT1-overexpression plasmid (SIRT1) transfected cells. Columns, mean of at least three independent experiments; bars, SEM. ***, P < 0.001, comparison between two groups as indicated. (e) Western blot was performed to monitor the expression levels of SIRT1 and Acetyl-H4K16 in cells transfected with pReceiver-M02 or SIRT1-overexpression plasmid (SIRT1). (f) Expression of miR17HG and miR-17–92 miRNAs in pReceiver-M02 or SIRT1 transfected cells. Columns, mean of at least three independent experiments; bars, SEM. *, P < 0.05; **, P< 0.01, comparison between two groups as indicated.
