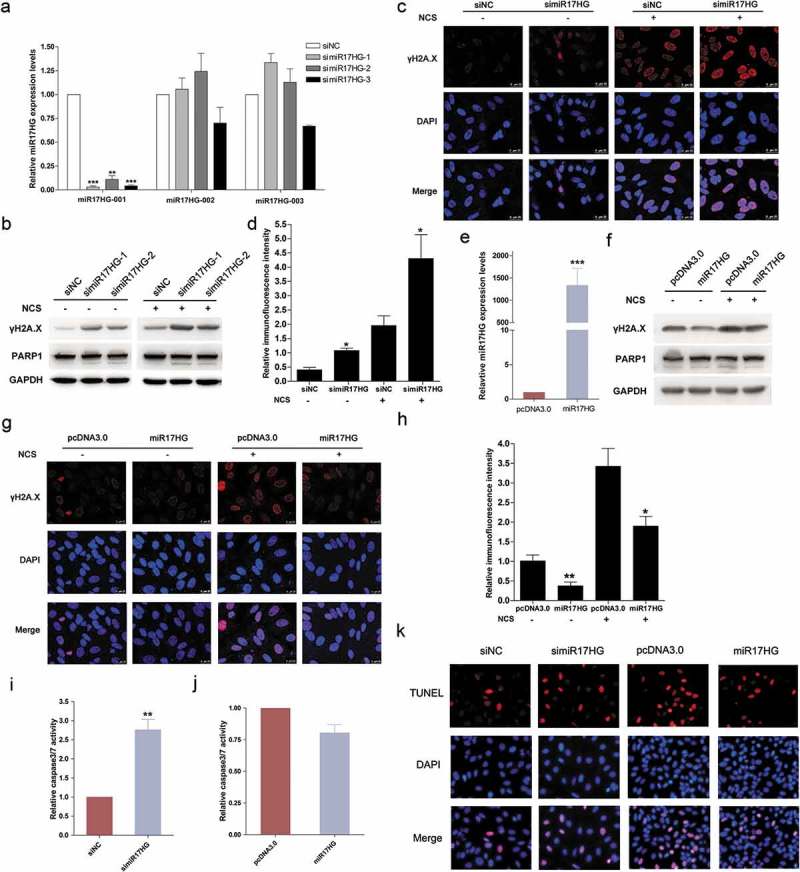
Figure 3.

miR17HG facilitated the repair of NCS-induced DNA DSBs. (a) Real-time qPCR was used to detect the expression levels of three miR17HG isoforms (ENST00000400282, designated as miR17HG-001; ENST00000582141, designated as miR17HG-002; ENST00000581816, designated as miR17HG-003) in 293 cells transfected with siNC or simiR17HG-1/2/3. Columns, mean of at least three independent experiments; bars, SEM. **, P < 0.01; ***, P < 0.001, comparison between two groups as indicated. (b) The γH2A.X expression levels and PARP-1 cleavage in cells transfected with siNC or simiR17HG-1/2 with or without NCS treatment. (c) Representative images of cells stained with DAPI (blue fluorescence) and γH2A.X (red fluorescence) in siNC or simiR17HG transfected cells with or without NCS treatment. (d) The relative fluorescence intensity of cells stained with DAPI (blue fluorescence) and γH2A.X (red fluorescence) in siNC or simiR17HG transfected cells with or without NCS treatment. Columns, mean of at least three independent experiments; bars, SEM. *, P < 0.05, comparison between two groups as indicated. (e) The miR17HG expression levels in cells transfected with pcDNA3.1 or miR17HG-overexpression plasmid (designated as miR17HG). Columns, mean of at least three independent experiments; bars, SEM. ***, P < 0.001, comparison between two groups as indicated. (f) The γH2A.X expression levels and PARP-1 cleavage in cells transfected with pcDNA3.1 or miR17HG-overexpression plasmid (miR17HG). (g) Representative images of cells stained with DAPI (blue fluorescence) and γH2A.X (red fluorescence) in pcDNA3.0 or miR17HG-overexpression plasmid (miR17HG) transfected cells with or without NCS treatment. (h) The relative fluorescence intensity of cells stained with DAPI (blue fluorescence) and γH2A.X (red fluorescence) in pcDNA3.0 or miR17HG-overexpression plasmid (miR17HG) transfected cells with or without NCS treatment. Columns, mean of at least three independent experiments; bars, SEM. *, P < 0.05; **, P < 0.01, comparison between two groups as indicated. (i) and (j) The caspase3/7 activity of cells transfected with siNC or simiR17HG (i), or pcDNA3.0 or miR17HG-overexpression plasmid (j). Columns, mean of at least three independent experiments; bars, SEM. **, P < 0.01, comparison between two groups as indicated. (k) The TUNEL assay of cells transfected with siNC or simiR17HG, or pcDNA3.0 or miR17HG-overexpression plasmid under NCS treatment.
