Table 1.
SAR Profile of Substituted Benzamide WDR5 WIN site inhibitors
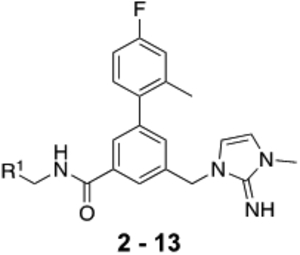 |
|||||||
|---|---|---|---|---|---|---|---|
| compnd | R1 = | Kd (nM) TR-FRET | HMT IC50 (nM) | Cell Proliferation Assays GI50 (nM) | Selectivity | ||
| WDR5 | MLL1 | MV4:11 | Molml3 | K562 | K562/MV4:11 | ||
| 2 | 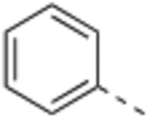 |
1.5 ±0.80 | 43.3 | 2300 ± 620 | 2000 ± 230 | 13000 ± 3000 | 5 |
| 3 | 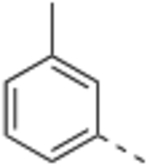 |
0.50 ±0.010 | 55.0 | 2400 ± 660 | 2700 ± 440 | 18000 ±6300 | 7 |
| 4 | 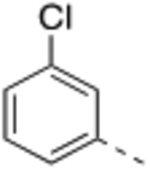 |
0.14 ±0.065 | 14.0 | 870 ± 320 | 840 ± 93 | 6400 ±1400 | 7 |
| 5 | 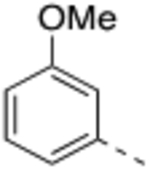 |
0.16 ±0.026 | 9.9 | 820 ± 400 | 970 ± 400 | 15000 ±850 | 18 |
| 6 | 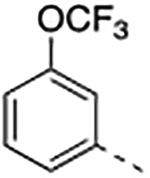 |
16 ± 14 | >3000 | 13000±1300 | 7600 ± 460 | 28000 ± 2400 | 2 |
| 7 |  |
0.030 ±0.014 | 3.4 | 390 ±150 | 390 ± 52 | 3600 ±1100 | 9 |
| 8 | 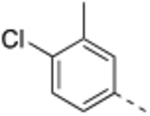 |
0.090 ± 0.002 | 28.4 | 1300±190 | 1500 ±220 | 10000 ± 3400 | 8 |
| 9 | 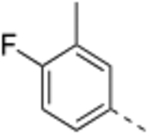 |
0.032 ± 0.005 | 11.6 | 360 ± 200 | 405 ± 83 | 7600±1500 | 21 |
| 10 |  |
0.035 ± 0.002 | 8.6 | 240 ± 28 | 300 ± 49 | 12000 ± 3800 | 50 |
| 11 | 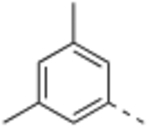 |
0.055 ± 0.021 | 23.9 | 340 ± 86 | 510 ±140 | 5900 ±1200 | 17 |
| 12 | 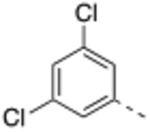 |
0.061 ± 0.023 | 3.4 | 490 ± 25 | 580 ±170 | 4900 ± 940 | 10 |
| 13 | 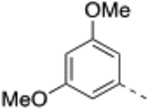 |
0.049 ± 0.008 | 3.4 | 470 ± 25 | 480 ±110 | 15000 ± 3600 | 32 |
TR-FRET Ki, and cell proliferation GI50 values represent four independent replicate determinations ± the standard deviation.
Histone methyltransferase inhibition (HMT) IC50 values represent two independent replicate determinations.
Selectivity is defined as GI50, K562/GI50, MV4:11.
