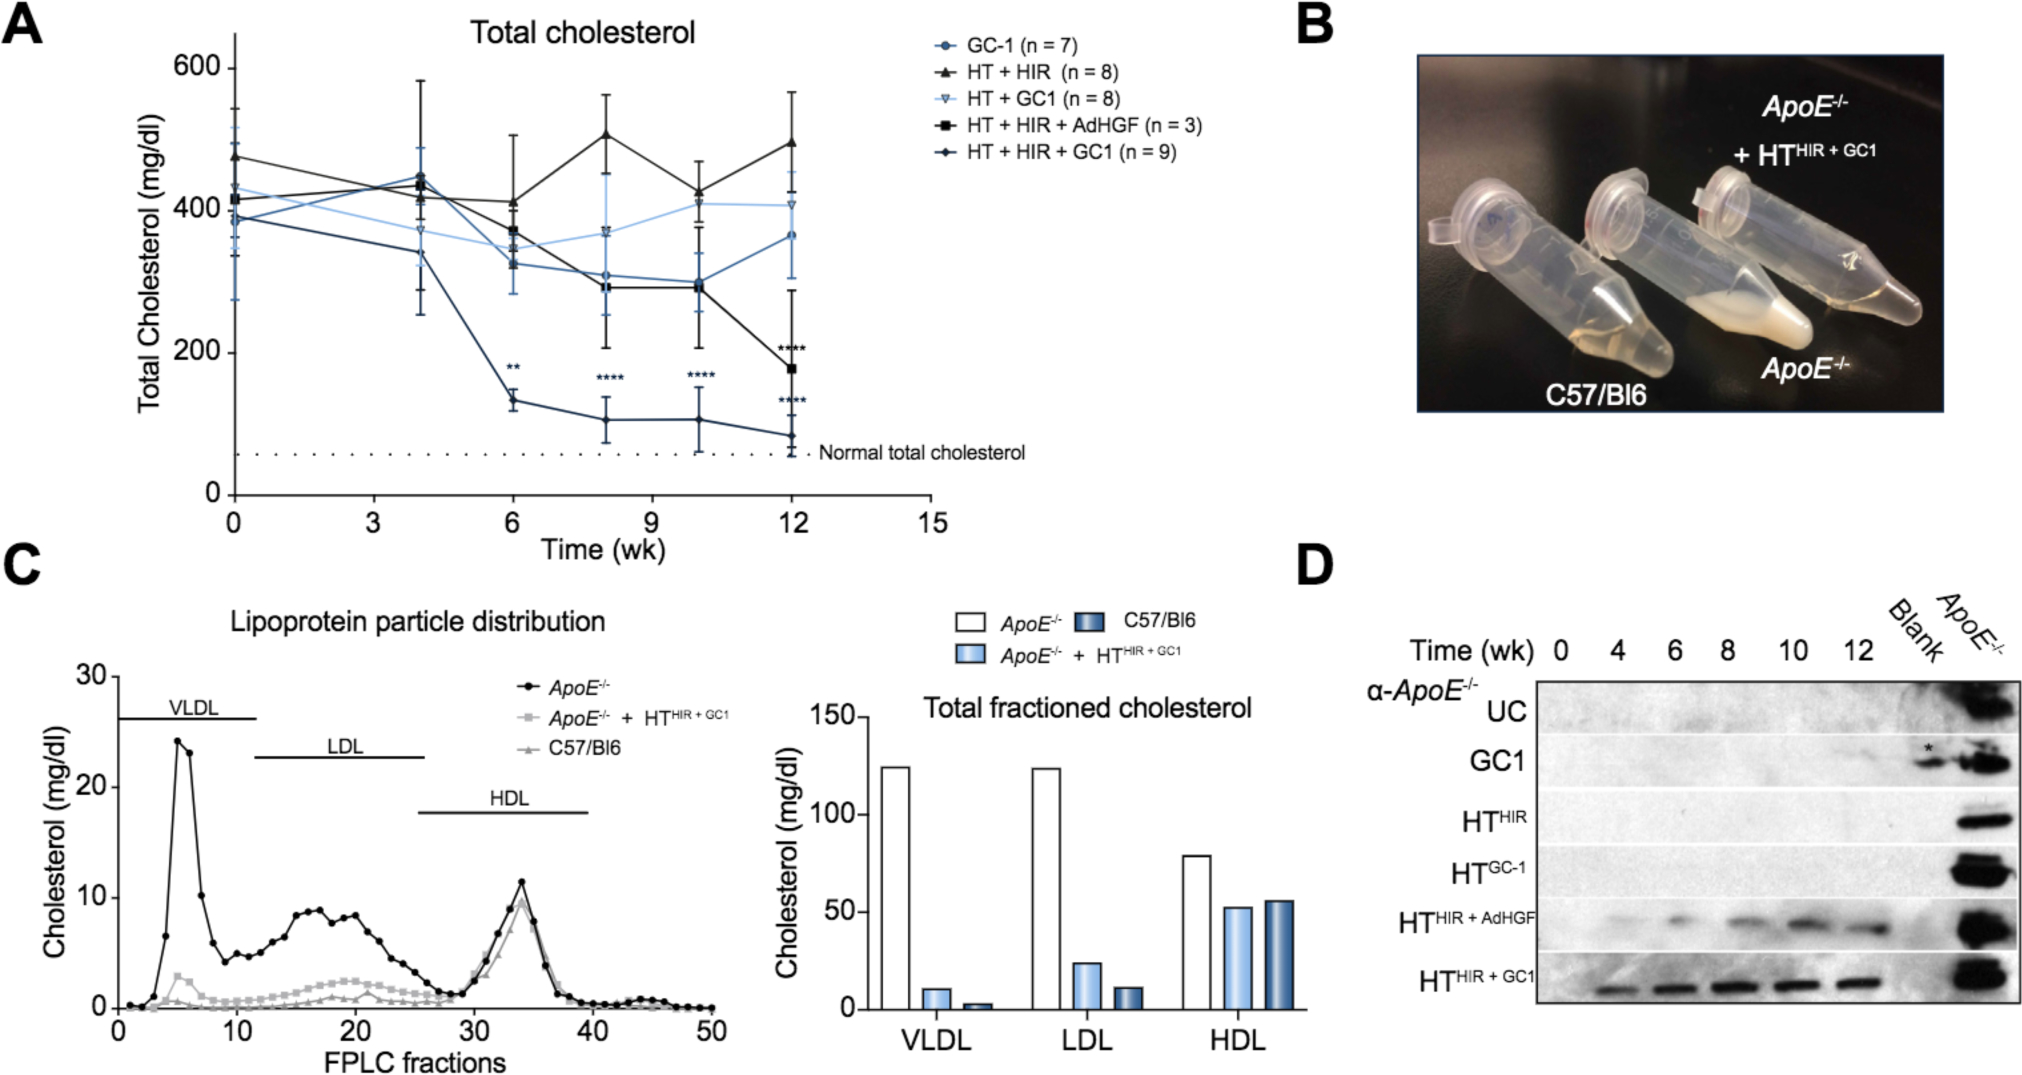
Fig. 4. Blood cholesterol measurements after HTHIR+mitogen in ApoE−/− mice.

(A) Total cholesterol over 12 weeks post treatment. (B) Pictograph showing raw plasma of C57/B16, ApoE−/− and HTHIR+GC1 -treated mice, 12 weeks post treatment. (C) FPLC analysis of lipoprotein particle size distribution in plasma 16 weeks post treatment. (D). ApoE Western blot. * = spill from positive control. FPLC, fast-protein liquid chromatography; HDL, high-density lipoprotein; HIR, hepatic irradiation; HT, hepatocyte transplantation; LDL, low-density lipoprotein; UC, untreated control; VLDL, very low-density lipoprotein.
