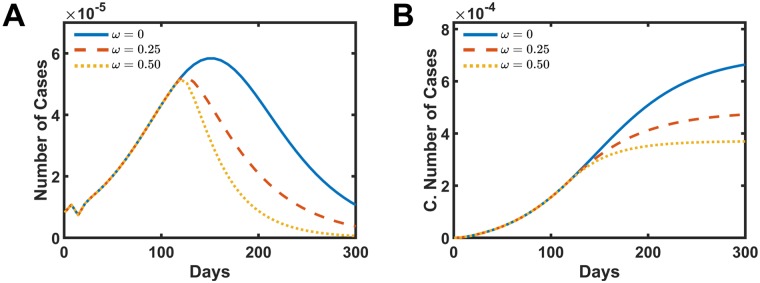
Fig 4. Simulated intervention results in increasing the mosquitoes mortality rate by fogging action.
A and B present the number of cases and the cumulative number of infect people, respectively. The solid blue line is the simulation without intervention ω = 0.0. The dashed red line presents the data for ω = 0.25, and the dotted yellow shows the data for ω = 0.5.

