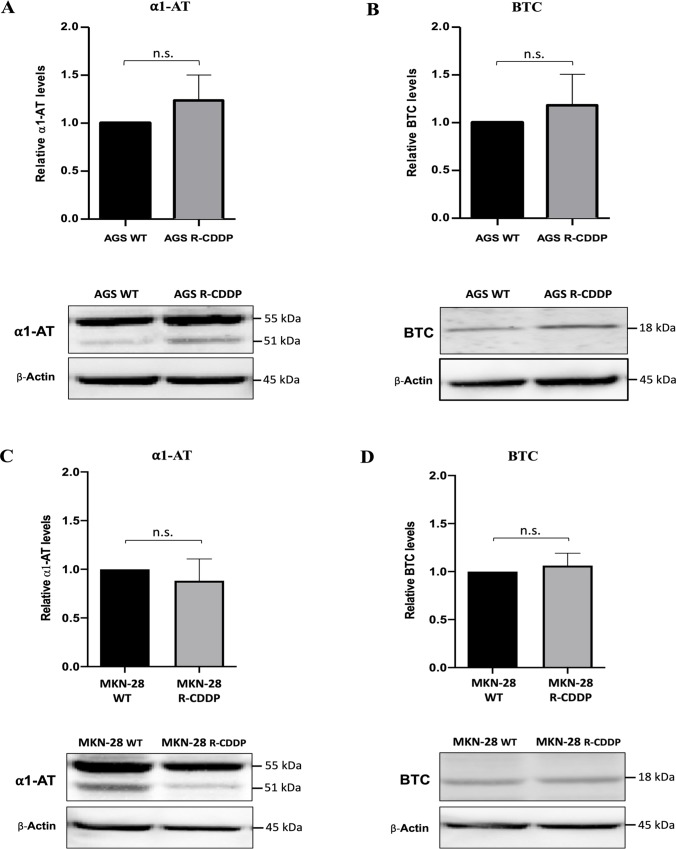
Fig 8. Validation of transcriptomic analyses by western blot.
Protein expression levels were analyzed by western blot. Then, densitometry analyses were performed using ImageJ software. (A) α-1-antitrypsin (α1-AT) expression in AGS WT cells and AGS R-CDDP cells; (B) BTC expression in AGS WT cells and AGS R-CDDP cells; (C) α1-AT expression in MKN-28 WT and MKN-28 R-CDDP cells; (D) BTC expression in MKN-28 WT and MKN-28 R-CDDP cells. β-Actin was used as control. The relative expression was quantify using arbitrary units. Mann-Whitney test was used to compare groups. Values of P<0.05 were considered statistically significant. *P<0.05, **P<0.01 and ***P<0.001. Data were expressed as mean ± SD of three biological replicates.

