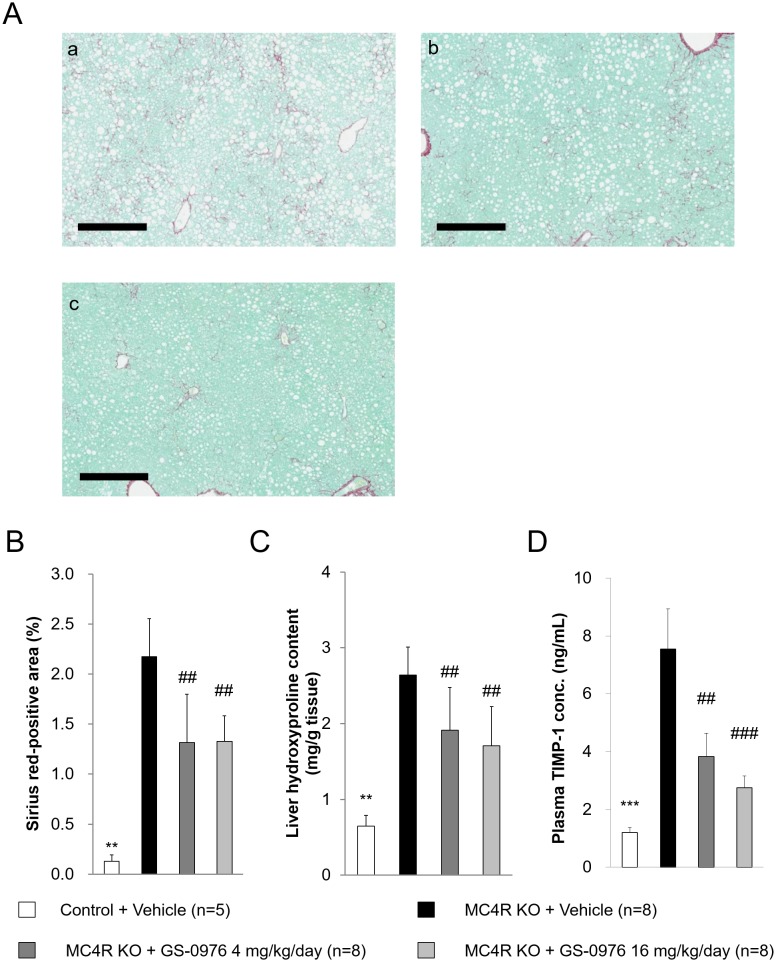
Fig 9. Effect of GS-0976 on fibrosis.
(A) Representative images of liver sections stained with Sirius Red from vehicle group (a), GS-0976 4 mg/kg/day group (b), and GS-0976 16 mg/kg/day group (c), bar = 400μm. (B) Fibrosis areas in Sirius Red-stained sections were quantified using Scanscope XT. (C) Hydroxyproline content was measured in the liver homogenates as an index of collagen content. (D) Plasma TIMP-1 concentrations were measured after 8-week treatment. Data are represented as the mean + SD, **p<0.01 vs. MC4R KO mice treated with vehicle by Aspin-Welch test. ##p<0.005 vs. MC4R KO mice treated with vehicle by one-tailed Williams’ test or Shirley-Williams test.

