. 2020 Jan 28;15(1):e0225433. doi: 10.1371/journal.pone.0225433

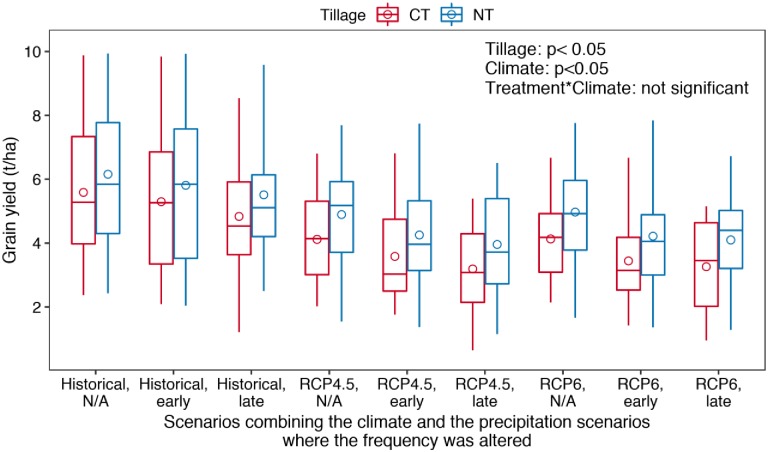
Fig 5. Distribution of the simulated maize grain yield under conventional (CT) and no-till (NT) treatments in the simulated 24 years under the nine climate treatments that combines three greenhouse gas concentration paths scenarios (historical, RCP4.5 and RCP6) and three precipitation frequency scenarios (no changes in precipitation frequency (N/A), and drought and heavy rainfall imposed for early or late growth stage) (p values are from the two-way ANOVA analysis; the top and the bottom of the box represent the first and the third quartile values, respectively; the line within the box presents the median value; the top and the bottom ends of the whiskers represent the maximum and the minimum values, respectively; the circle represents the mean value).

Fig 5