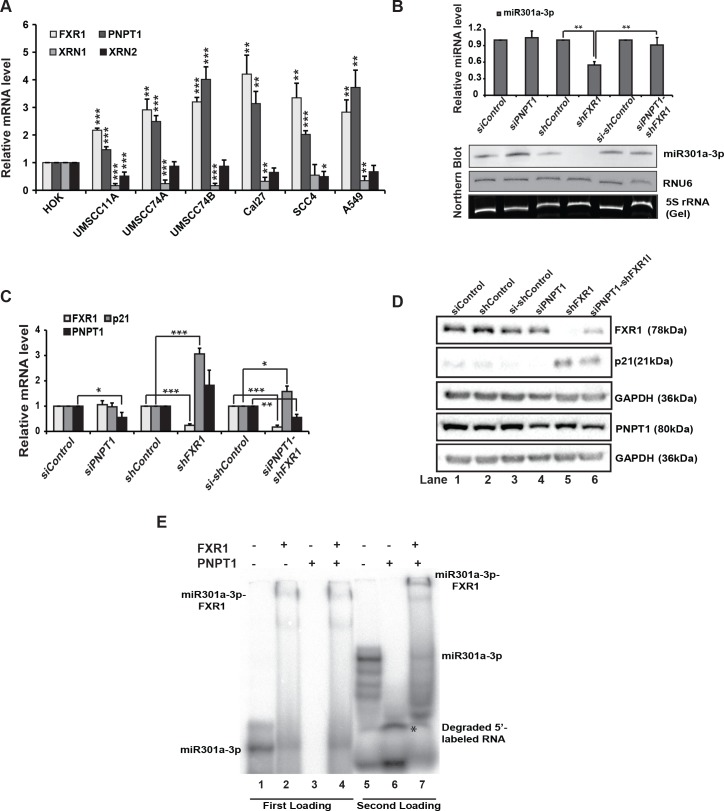
Fig 4. PNPT1 is overexpressed in HNSCC that degrades miR301a-3p in the absence of FXR1.
(A) qRT-PCR analysis of FXR1, XRN1, XRN2, and PNPT1 in HNSCC cell lines compared to primary line HOK along with lung cancer cell line A549. Both ACTIN and RPS18 served as endogenous controls. (B) (up) qRT-PCR analyses to test the expression of miR301a-3p in UMSCC74B cells under individual and double knockdown of FXR1 and PNPT1. RNU6 served as an endogenous control. (down) Northern hybridization of total RNA isolated from UMSCC74B cells under individual and double knockdown of FXR1 and PNPT1 shows the levels of miR301a-3p. RNU6 is used as an endogenous control. 5S rRNA is used as a loading control. (C) qRT-PCR analysis of FXR1, p21, and PNPT1 in UMSCC74B cells under individual and double knockdown of FXR1 and PNPT1. Both ACTIN and RPS18 served as endogenous controls. (D) Western blot analysis of FXR1, p21, and PNPT1 in UMSCC74B under individual and double knockdown of FXR1 and PNPT1. GAPDH serves as an endogenous control. (E) EMSA with 5’-labeled miR301a-3p with rec. FXR1 and rec. PNPT1 proteins. L1: RNA only, L2: RNA + FXR1, L3: RNA + PNPT1, L4: RNA + FXR1 (5 pmole) for 15 min, followed by PNPT1 (5 pmole) for another 15 min. L5-7: samples are loaded 2 hours after the first loading of from L1,3, and 4 to visualize the bottom of the gel. Statistical significance (p-value): *<0.05; **<0.005; ***<0.0005. See also S4 Fig.

