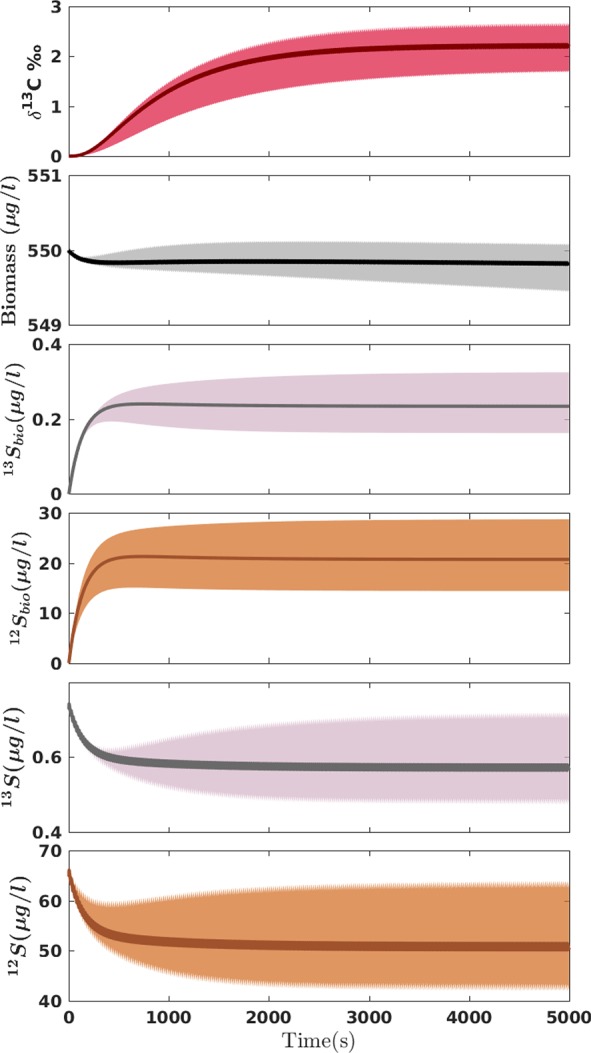
Figure 4.

Uncertainty analysis using a Monte Carlo simulation. The 68% confidence intervals are shown for all the output parameters, from top to bottom, isotopic signature, biomass concentration, bioavailable, and bulk substrate concentrations (for both heavy and light isotopologues respectively). Note that the perturbations resulting from the periodic inlet are more visible at the profiles for bulk concentrations and δ13C-values.
