
Figure 2.
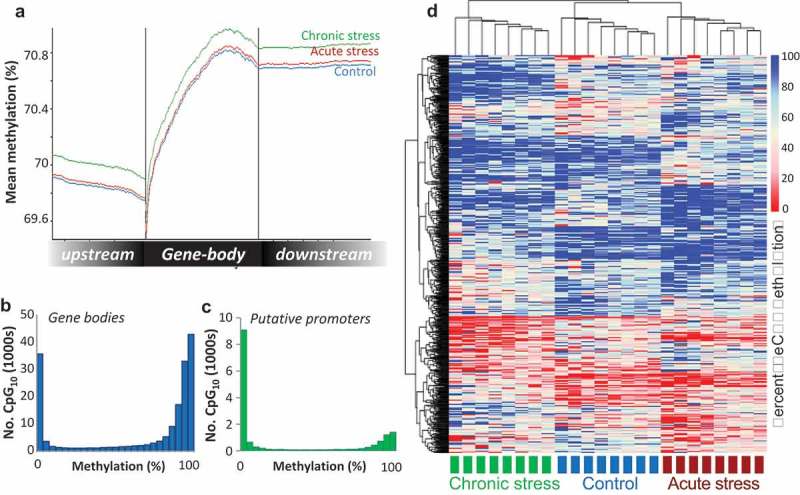
Visualisation of the Atlantic salmon gill methylome. (a) Average CpG methylation percentage in gene bodies and within the 1.5 Kb upstream and downstream of the transcription start (TSS) and termination sites (TTS) for each stress group. (b-c) Histograms of average methylation distribution within gene bodies and putative promoter regions. (d) Heat map illustrating percentage methylation for all differentially methylated CpGs identified in response to acute and/or chronic stress (logistic regression q < 0.01 and |ΔM|>20%, and t.test p < 0.01) in all individuals at the baseline time-point, using unsupervised hierarchical clustering.