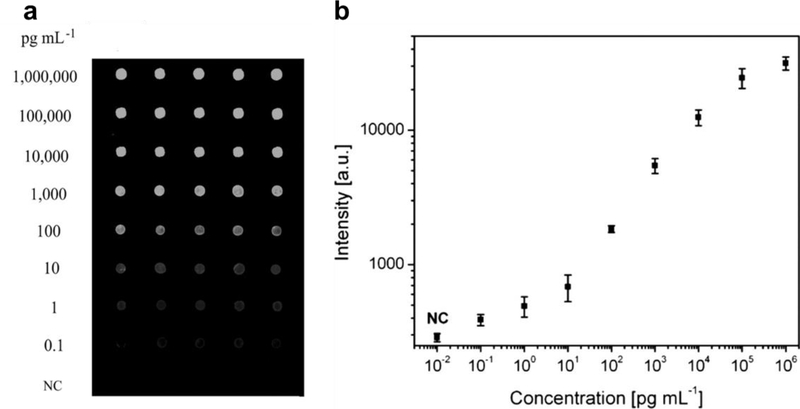
Figure 4. Antibody microarray on POEGMA‐co‐GMA brushes “grafted from” ZnO nanorods.
A) Fluorescent images, with concentration of CEA and B) plotted dose response curve for detection of CEA spiked into human serum, with a LOD of 100 fg mL-1. Adapted with permission.[93] Copyright 2014, John Wiley and Sons.

