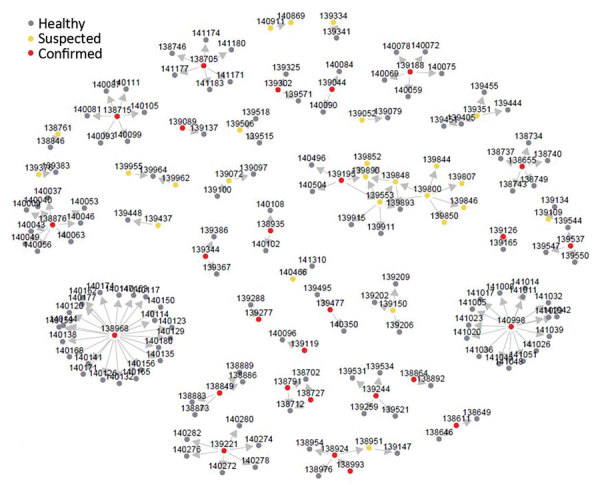
Figure 2.

Network diagram for monkeypox cases and contact persons in Nigeria notified November 2017–July 2019. The nodes are labeled with unique identifiers for each person and colored by their classification status. Among case-patients, >1 contact person was reported for 57 (24%). The average number of contact persons/case-patient was 3 (quartiles 1–4, range 1–23). Arrows show the possible direction of infection transmission.
