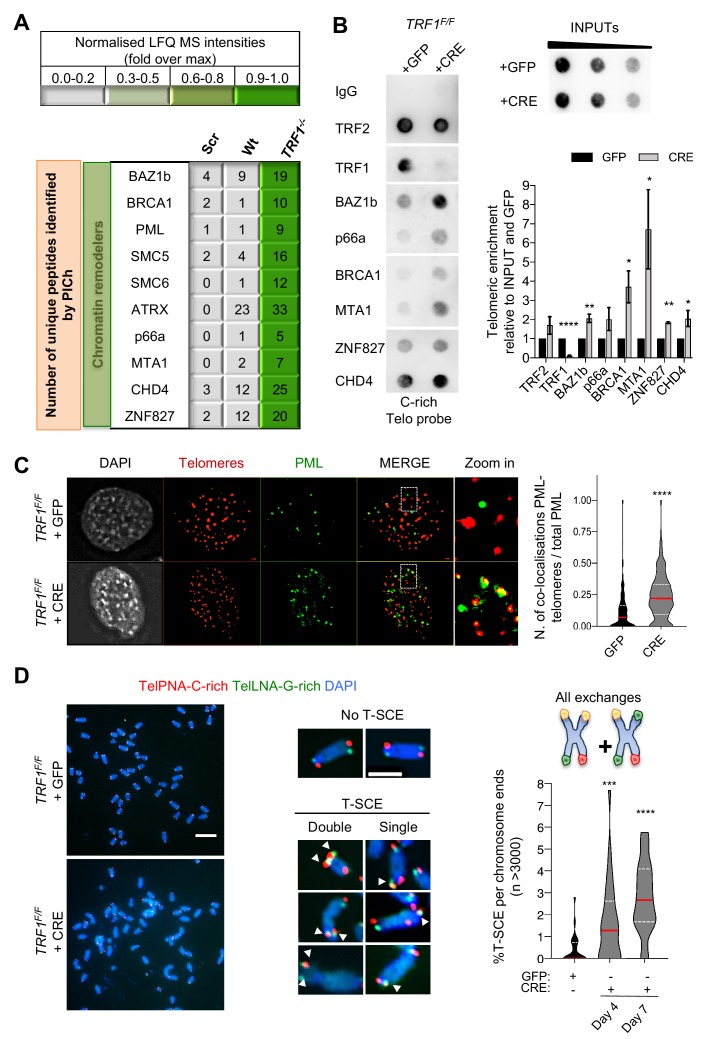
Figure 2. Recombination factors are recruited at TRF1 depleted telomeres.
(A) Table listing chromatin remodellers identified. The corresponding number of unique peptide isolated is indicated for each factor of interest. Same as in Figure 1, light to darker colours indicate increasing relative protein abundance. (B) Validation of chromatin remodeller factors by ChIP-dot blot analysis in wt (+GFP) and TRF1-/- (+CRE) conditions using ChIP grade antibodies against chosen factors after chromatin preparation from MEFs. The blot was revealed with a DIG-Tel-C-rich probe. ChIP signals were normalised to DNA input and GFP control. Data are represented as telomeric enrichment of proteins relative to GFP ± SEM of at least three independent biological replicates. P values, two-tailed student t-test (*, p<0.05; **, p<0.01; ****, p<0.0001). (C) Representative image of Immunofluorescence showing co-localisation of Telomeres (red) with PML (green) in MEFs nuclei (DAPI) treated with GFP and CRE. Data from two independent biological replicates are represented as number of Telomeres-PML co-localising foci divided by the total number of PML present per nucleus (n = 300 nuclei) with a violin plot, where the median is underlined in red and quartiles in white. P values, two-tailed student t-test (****, p<0.0001). Source data are provided as a Source Data File. (D) Representative images of the chromosome-oriented CO-FISH assay with denaturation, used to score for telomeric T-SCEs in TRF1F/F MEFs infected with GFP or CRE. Telomeres are labelled with TelPNA-C-rich-Cy3 (red) and TelLNA-G-rich-FAM (green), while chromosomes are counterstained with DAPI (blue). Scale bar, 10 µm. Enlarged intersections show the difference between a chromosome with No T-SCE (top) and a chromosome with T-SCE (bottom). T-SCE images show double T-SCEs (left) and single chromatid events (right). Scale bar, 2 µm. For quantification, T-SCE was considered positive when involved in a reciprocal exchange of telomere signal with its sister chromatid (both telomeres yellow) and for asymmetrical exchanges at single chromatid (one telomere yellow). Data are indicated as % of T-SCE per sister telomere (n = > 3000 chromsome ends) and are represented with a violin plot, where the median is underlined in red and quartiles in white. P value, two-tailed student t-test (****, p<0.0001).


