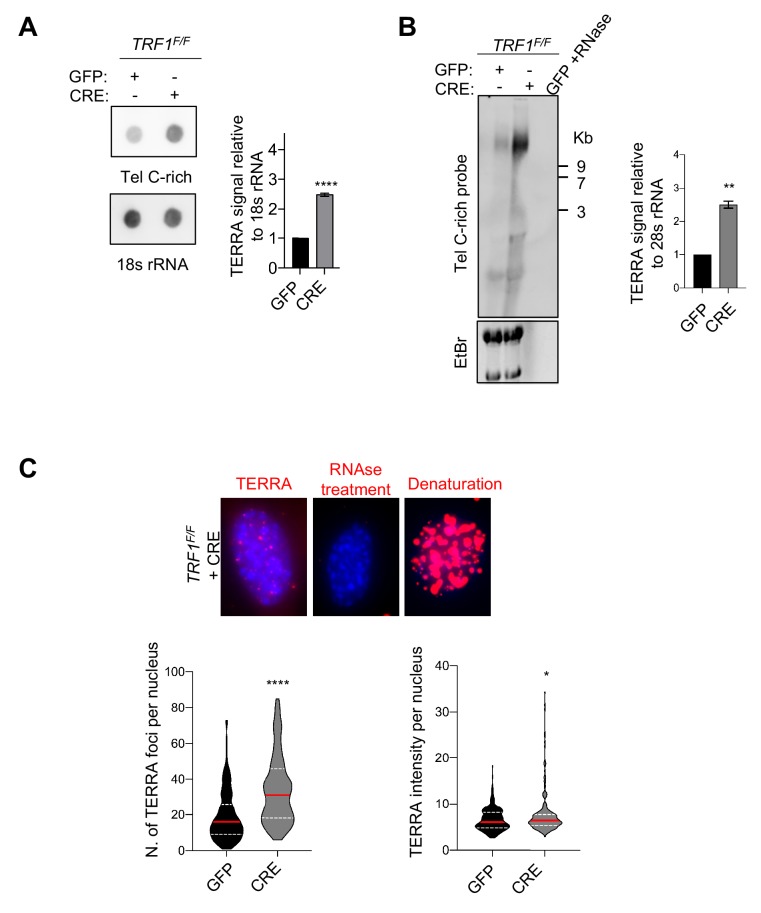
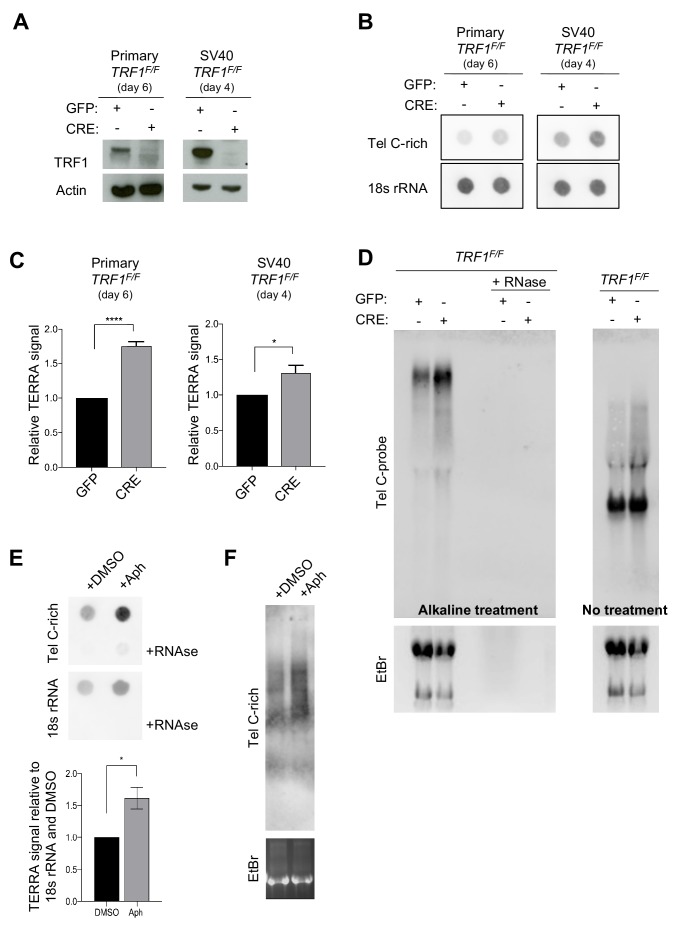
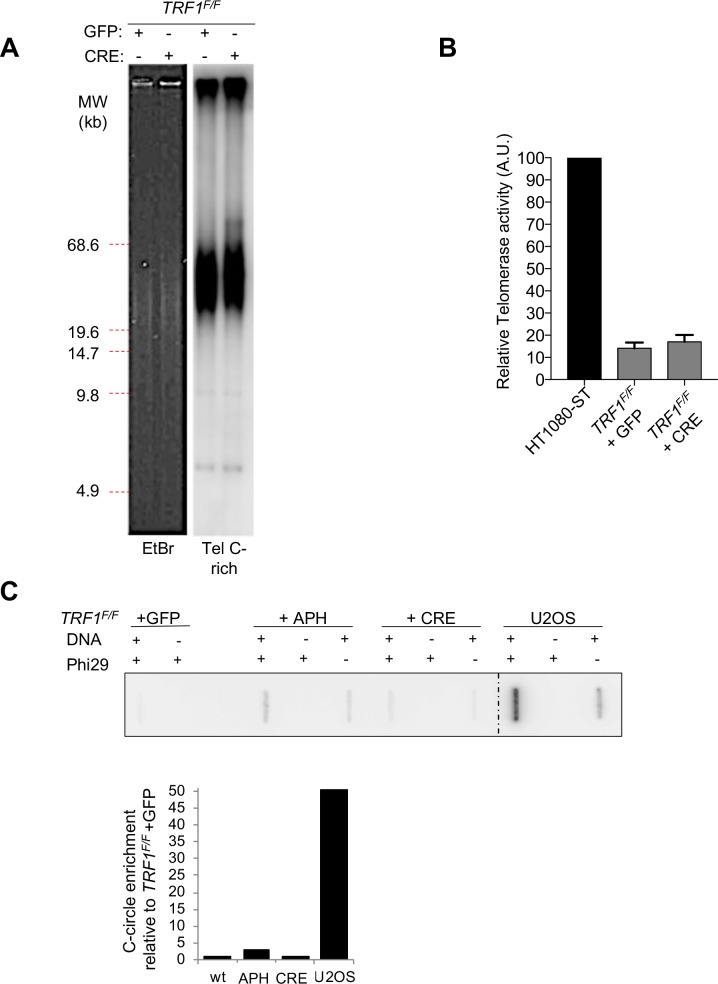
Figure 3. TRF1 depletion causes TERRAs upregulation.
(A) RNA dot blot analysis in wt and TRF1 deleted MEFs. The blot was revealed with a DIG-Tel-C-rich probe or 18 s rRNA as a control. TERRA signals were normalised to 18 s rRNA and GFP control ± SEM of at least three independent biological replicates. P values, two-tailed student t-test (****, p<0.0001). (B) TERRA detection by Northern blotting upon TRF1 deletion. The blot was revealed with a DIG-Tel-C-rich probe (upper part). Ethidium bromide (EtBr) staining (bottom) of rRNAs was used as loading control. TERRA signals were normalized to 28 s rRNA signal from EtBr staining ± SEM of 2 independent biological replicates. P values, two-tailed student t-test (**, p<0.01). (C) Representative images of TERRA-FISH experiment (top panel) showing the difference between cells stained with TERRA (red), negative control with RNAse A treatment and positive control after denaturation. TERRA-FISH quantification (bottom panel) in wt (+GFP) and TRF1-/- (+CRE) conditions. Violin plots are representing the number of TERRA foci (left) and TERRA intensity (right) (n = 250) per nucleus, where the median is underlined in red and quartiles in white, two-tailed student t-test (****, p<0.0001); Mann-Whitney test used for TERRA intensity quantification (*, p<0.05).


