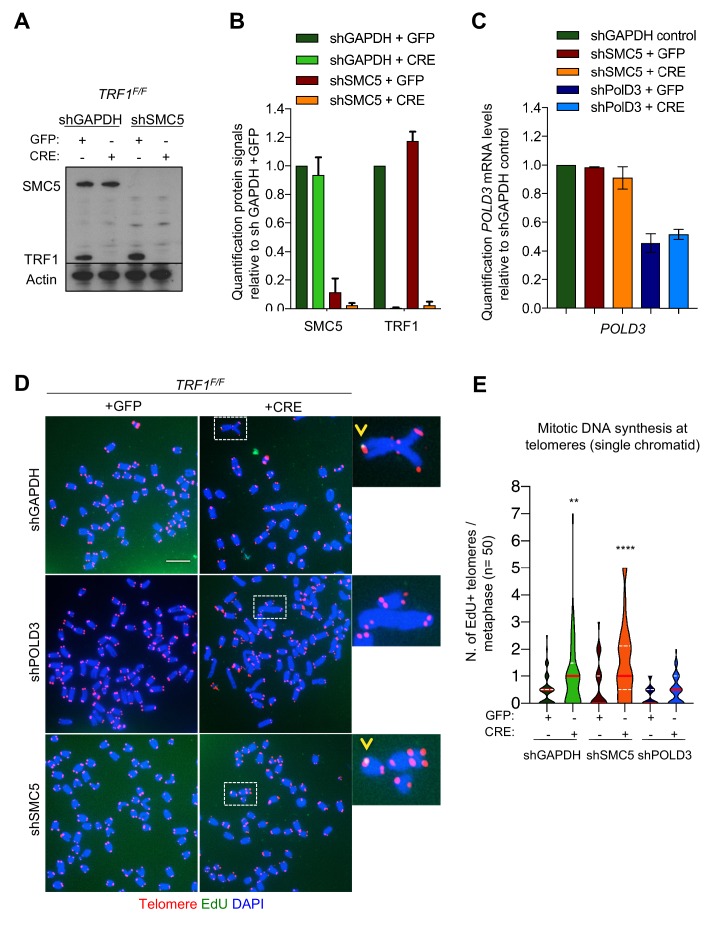
Figure 6. POLD3 but not SMC5 regulates mitotic DNA synthesis at TRF1 deleted telomeres.
(A) Western blotting showing expression of SMC5, TRF1 and Actin (loading control) proteins in TRF1F/F MEFs after infection with GFP or CRE-Adenovirus and deletion of SMC5 by shRNA. shGAPDH is used as negative control. (B) Quantification of the knock-out and knock-down shown in A. Graph shows protein signal quantification relative to shGAPDH in +GFP control cells, data are represented as mean ± SEM of 3 independent biological replicates. (C) Quantification of POLD3 mRNA levels relative to GAPDH control. Data are represented as mean ± SEM of 3 independent biological replicates. (D) Representative images of 6 different genotypes generated in the above description. Metaphases show EdU (green), telomeres labelled with TelPNA-C-rich-Cy3 (red) and chromosomes counterstained with DAPI (blue). Scale bar, 10 µm. (E) Quantification of mitotic DNA synthesis at telomeres (single chromatid) in TRF1F/F MEFs infected with shGAPDH control (GFP or CRE), shSMC5 (GFP or CRE) and shPOLD3 (GFP or CRE). Data are represented (n = 50 metaphases) as number of EdU positive telomeres per metaphase with a violin plot, where the median is underlined in red and quartiles in white. One-way ANOVA multiple comparisons (**, p<0.01; ****, p<0.0001) relative to shGAPDH+GFP sample. Source data are provided as a Source Data File.


