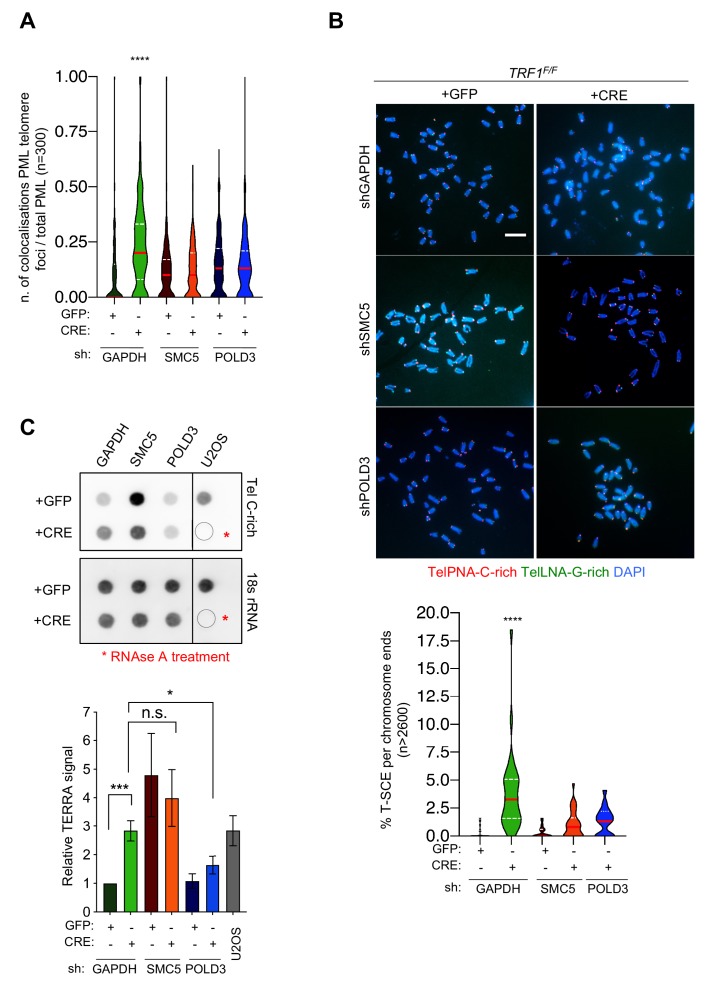
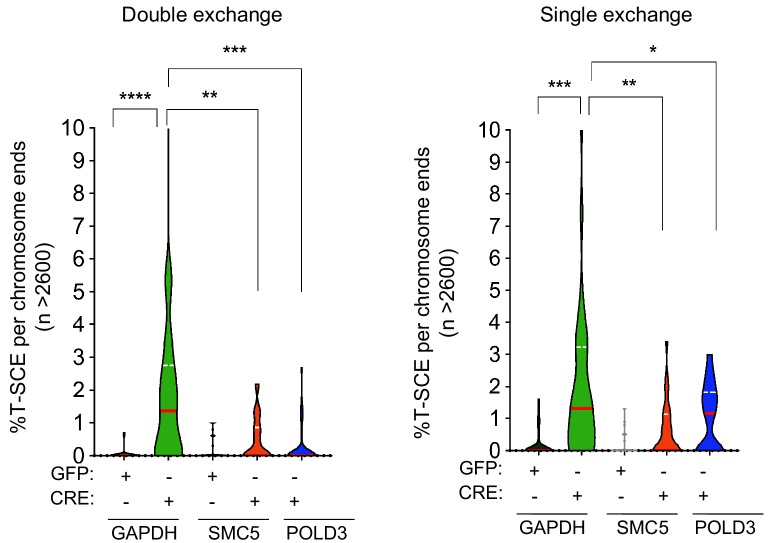
Figure 7. SMC5 and POLD3 are required for induction of recombination at TRF1 deficient telomeres.
(A) APBs formation in TRF1 deleted cells is rescued in double mutants TRF1-SMC5 and TRF1-POLD3. Quantification of APBs formation is represented as number of co-localising PML-telomere foci divided by the total number of PML present per nucleus (n = 300 nuclei analysed) from three independent biological replicates. Data are represented with a violin plot, where the median is underlined in red and quartiles in white. One-way ANOVA multiple comparisons (****, p<0.0001) relative to shGAPDH+GFP sample. (B) Representative images of the chromosome oriented (CO)-FISH assay with denaturation, used to score for telomeric T-SCEs in TRF1F/F MEFs infected with shGAPHH control (GFP or CRE), shSMC5 (GFP or CRE) and shPOLD3 (GFP or CRE). Telomeres are labelled with TelPNA-C-rich-Cy3 (red) and TelLNA-G-rich-FAM (green), while chromosomes are counterstained with DAPI (blue). Scale bar, 10 µm. For quantification T-SCE was considered positive when involved in a reciprocal exchange of telomere signal with its sister chromatid (both telomeres yellow) and for asymmetrical exchanges at single chromatid (one telomere yellow). Data are indicated as % of T-SCE per sister telomere (bottom panel). Data (n = > 2600 chromsome ends) from three independent biological replicates are indicated in a violin plot, where the median is underlined in red and quartiles in white. One-way ANOVA multiple comparisons (****, p<0.0001) relative to shGAPDH+GFP sample. (C) RNA dot blot analysis in TRF1, SMC5, POLD3 single and double mutants. The blot was revealed with a DIG-Tel-C-rich probe or 18 s rRNA as a control. TERRA signals were normalised to 18 s rRNA and GFP control (bottom panel). Data are represented as relative TERRA signal ± SEM of 4 independent biological replicates. P values, two-tailed student t-test (*, p<0.05; ***, p<0.001; n.s. = non significant). Source data are provided as a Source Data File.


