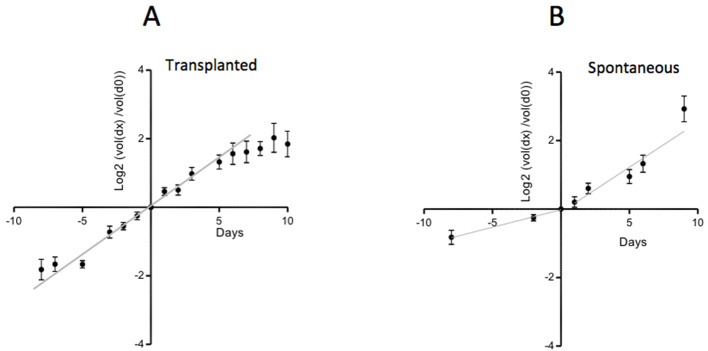
Figure 2. Growth rate of TP and SP PyMT tumors.
(A) The growth of TP tumors slows down with time. (B) The growth of SP tumors, which is initially slow, accelerates with time. Data from 45 tumors from 45 TP mice and 26 tumors from 9 SP mice. The small and large tumor diameters, d and D, were measured with calipers. Tumor volume was approximated by the volume of a spheroid (d2.D/2). For each tumor, the volume at time day x is expressed relative to its volume at day 0, when the tumor volume was ~ 50–150 mm3. The ratios (volume(dx)/volume(d0)) expressed on a Log2 scale, are represented as a function of time.

