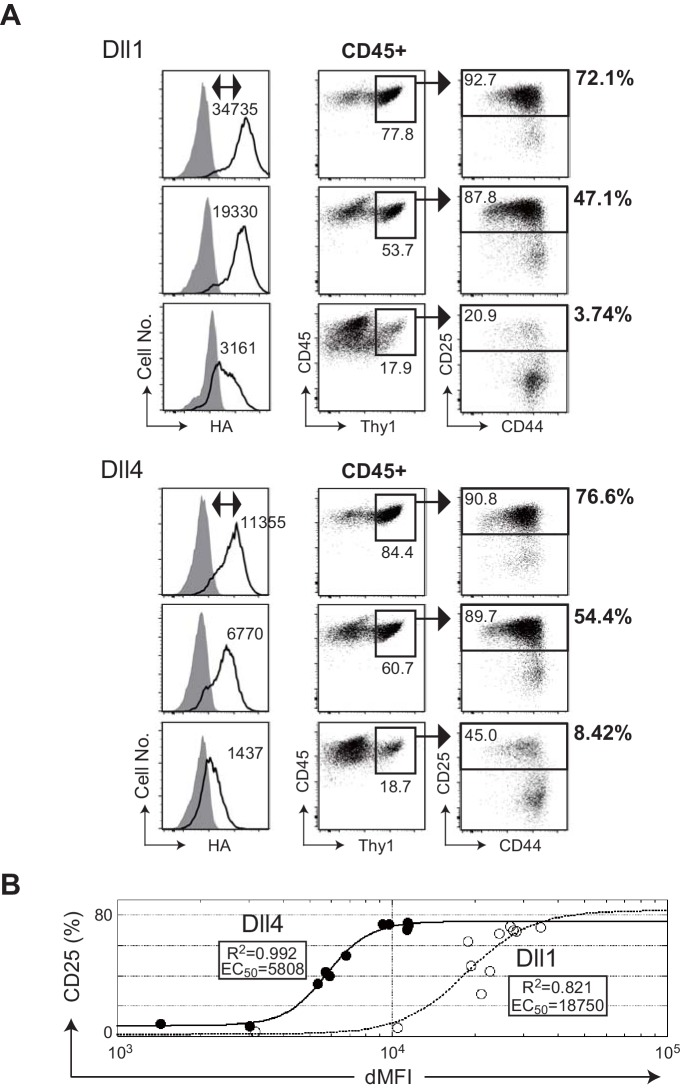
Figure 2. The efficiencies of T cell induction from hematopoietic progenitors by Dll1 or Dll4 on the monolayer cultures with OP9 stromal cells.
(A) Serial induction of exogenous Dll1 or Dll4 labeled at the C-terminus with HA-epitope driven by Tet-off system in OP9 cells was detected by flow cytometry using anti-HA mAb for intracellular staining. OP9 transfectants were treated with doxycycline (0.01, 0.8, and 0.3 ng/mL) for Dll1 or Dll4 to suppress the full activation of their transcription. Open histograms indicate anti-HA mAb staining (Dll1 or Dll4), and filled histograms indicate staining with control rabbit IgG. The difference of each MFI (dMFI) is shown in the left panels. E14.5 fetal liver-derived lineage markers (Gr-1, CD11b, TER119, and CD19)-negative c-kit-positive hematopoietic progenitors were cultured on the Dll1- or Dll4-bearing OP9 cells for 7 days and stained with lineage markers for analysis (Gr-1, CD11b, ST2, and DX5) and (CD45, CD19, Thy1, CD44, and CD25). CD45+ and CD45+Thy1.2+ cells were analyzed in the center and right panels, respectively. The frequencies (%) of lineage markers-negative CD19-Thy1+CD25+ T-lineage cells in CD45+ live cells are shown in the right side of the panels. Numbers in the dot-plot represent the relative percentages for each corresponding fraction. (B) The effectiveness of serial expression (dMFI) of Dll1 (open circle, dotted line) or Dll4 (closed circle, solid line) on OP9 cells for the induction of CD25+T-lineage cells (CD25) shown in A was evaluated by logistic regression analysis. In a 4-parameter logistic equation, EC50 and R2 values were calculated and shown in the graph.

