. 2020 Jan 16;9:e50979. doi: 10.7554/eLife.50979

Figure 3. The swapping chimeras of DSL domain and/or the 1st/2nd EGF-like repeats between Dll1 and Dll4.

(A) Schematic structure of the Dll variants. Dll1 and Dll4 were intact and depicted by open (Dll1) or filled (Dll4) columns. The DSL domain and the 1st/2nd EGF-like repeats (E1-2) were represented by circle and top region of square, respectively. D1-D4DSL, D1-D4E1-2, and D1-DSL/E1-2 were Dll1-based chimeras with Dll4-derived DSL domain and/or E1-2. Similarly, Dll4-based chimeras were generated with Dll1-derived domains (D4-D1DSL, D4-D1E1-2, and D4-D1DSL/E1-2). Expression of NotchLs were monitored by GFP expression (Figure 3—figure supplement 2). (B) The swapping chimeras of DSL domain and/or the 1st/2nd EGF-like repeats transduce Notch signaling. Stable transfectants expressing murine Notch1 and control vector (Notch1, open column) or Notch1 and Lfng (Lfng-N1, filled column) were transiently transfected with a TP1-luciferase reporter plasmid, pGa981-6, and a pRL-TK plasmid for internal control. Cells were harvested at 24 hr after transfection, and co-cultured for an additional 40 hr with the transfectants expressing the DSL/E1-2 swapping chimeras. The relative induction of luciferase activity in each sample (mean ± SD, n = 3; ***, p<0.001; unpaired Student’s t-test) was calculated and described as fold activation against the control (value from the culture with mock transfectant not expressing Notch ligand). Data represents three independent experiments. (C) Monoclonal antibody originally established by us, HRJ1-5, broadly reacted with murine Jag1, Jag2, and Dll1, but not with Dll4. The transfectants of BM-derived mesenchymal cell line, originally not expressing any Notch ligands, established in our lab, expressing murine Jag1, Jag2, Dll1, or Dll4, were stained with HRJ1-5, and analyzed by flow cytometry. Open histograms indicate HRJ1-5 staining and filled histograms indicate staining with control hamster IgG. (D) Reactivity of HRJ1-5 with Dll chimeras. Each transfectant shown in the panel was stained with HRJ1-5 and analyzed as in C.

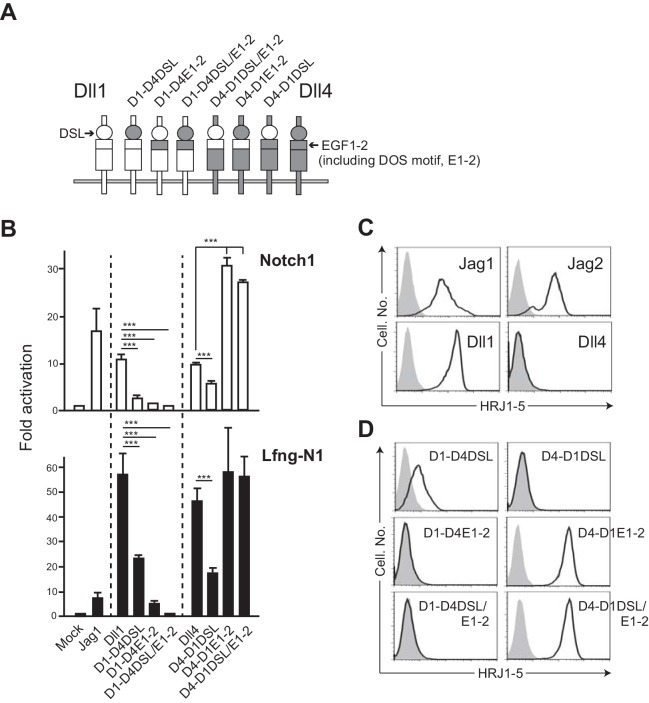
Figure 3—source data 1. Raw data (Fold activation) of luciferase activity used to generate the graph in Figure 3B.

Figure 3.

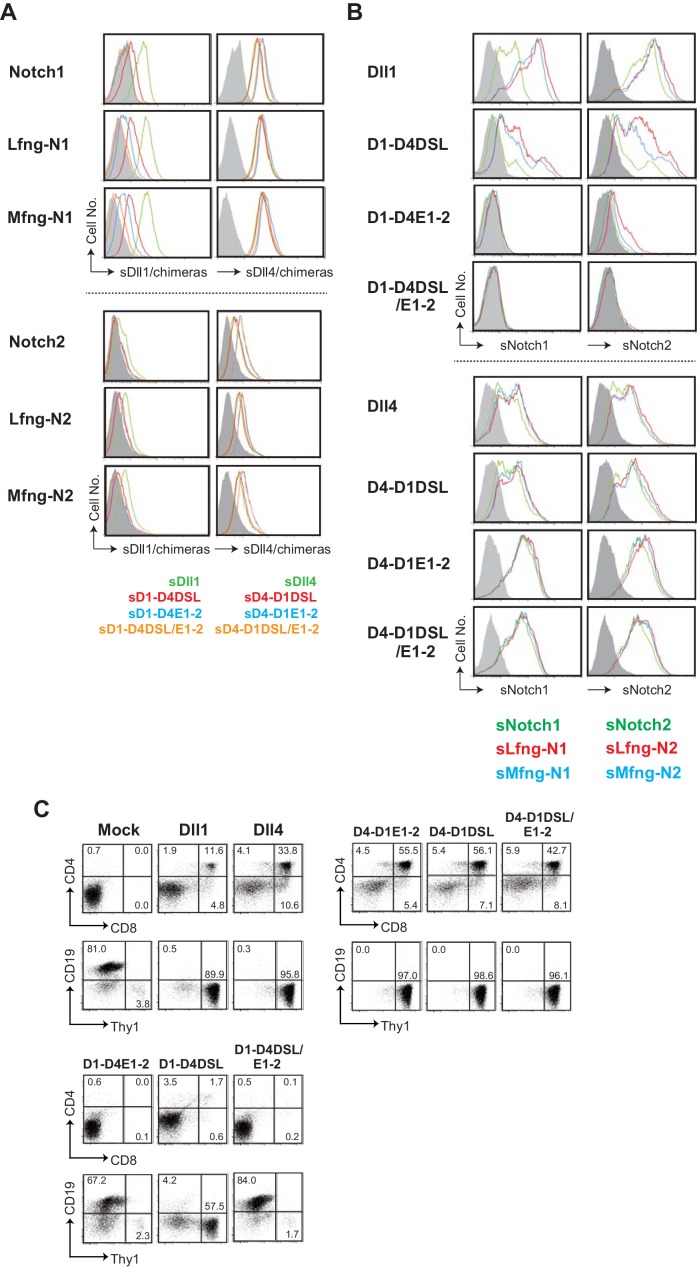
Figure 3—figure supplement 1. Characterization of the swapping chimeras of DSL and/or the 1st/2nd EGF-like repeats (EGF1-2) between Dll1 and Dll4.

Figure 3—figure supplement 1.

(A) Binding activity of soluble swapping chimeras based on Dll1 or Dll4 to Notch1 or Notch2 expressed on the surface of BM-derived mesenchymal cells with or without the glycosylation by lunatic or manic fringe (Lfng, Mfng) is measured by flow cytometry. Soluble Dll chimeras, depicted in Figure 3A, are composed of the extracellular region of Dll1, Dll4, or their chimeras and Fc domain of human IgG1. Soluble Dll1 (green), D1-D4DSL (red), D1-D4DOS (blue), and D1-D4DSL/DOS (orange), shown in the right side of panels, were prepared and incubated with Notch1 transfectants. Their bindings were detected by anti-human IgG Ab and shown in the first lane of upper panels. Soluble Dll4 (green), D4-D1DSL (red), D4-D1DOS (blue), and D4-D1DSL/DOS (orange) were also used in the second lane of upper panels. Similarly, soluble Dll-derived molecules were used to check their binding activities to the Notch2 transfectants with or without glycosylation in the lower panels. (B) Binding activity of the DSL/EGF1-2 swapping chimeras with soluble Notch1 and Notch2. Soluble Notch receptors are composed of the N-terminus to 15th EGF repeats and the Fc domain of human IgG1. The transfectants expressing Dll1, Dll4, or their chimeras were incubated with soluble Notch1 (sNotch1) or Notch2 (sNotch2), and their binding were detected. The soluble Notchs were produced by CHO cells expressing murine Lfng (red line), Mfng (blue line), or vector control (green line), and used in this experiment. (C) Induction of T-lineage cells by the swapping chimeras in vitro. Fetal liver-derived lineage markers-negative c-kit-positive hematopoietic progenitors were cultured on the OP9 cells expressing Dll1, Dll4, or their chimeras for 13 days. After the cultures, live cells were stained with CD19, Thy1, CD4, and CD8, and analyzed by flow cytometry. Numbers in the dot-plot represent the relative percentages for each corresponding quadrants.
Figure 3—figure supplement 2. NotchLs transfectants used in Figure 3 were established via infection with a retrovirus encoding the respective NotchL or their chimeric molecules of parental fibroblast cell lines (parent), and were monitored via GFP expression by flow cytometry.

Figure 3—figure supplement 2.

The numbers in parenthesis represent the mean fluorescence intensity (MFI).