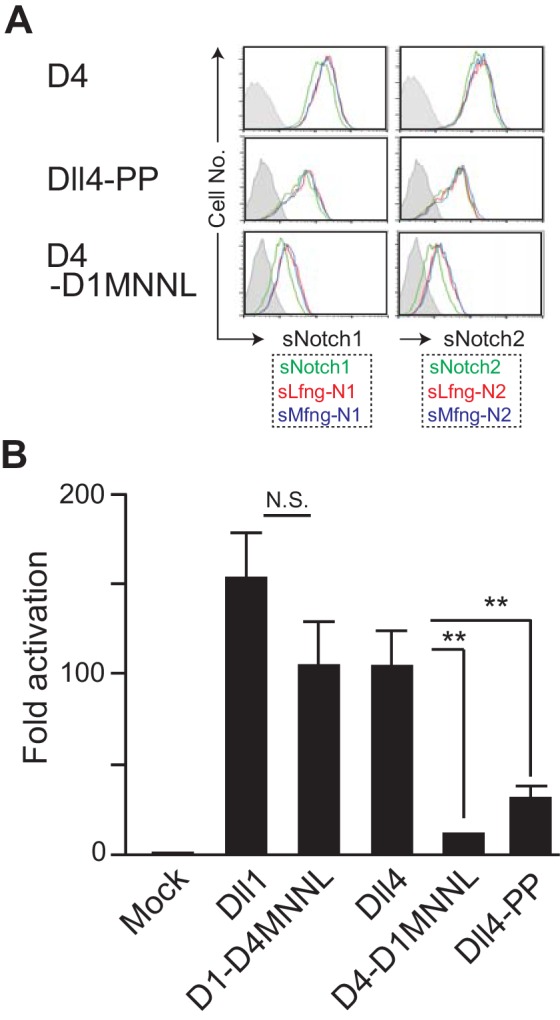
Figure 6. Effect of the mutation in the loop structure of MNNL domain of Dll4.
(A) Binding activity with the soluble Notch1 and Notch2 was detected by flow cytometry as shown in Figure 4B. (B) Inducing activity of Notch signaling in vitro was examined by the co-cultures of NotchL and Notch1/Lfng transfectants as shown in Figure 3B. The fold activation against the control was calculated from each sample (mean ± SD, n = 3; **, p<0.01; N.S.: not significant; unpaired Student’s t-test). Data represents three independent experiments. Expression of NotchLs were monitored by the GFP expression, the intracellular staining with anti-HA mAb and the surface staining with HRJ1-5 or anti-Dll4 mAbs (Figure 6—figure supplement 1).

Figure 6—figure supplement 1. NotchLs transfectants used in Figure 6 were monitored by the expression of GFP and the staining with anti-HA, anti-Dll4 or HRJ1-5 mAbs.

