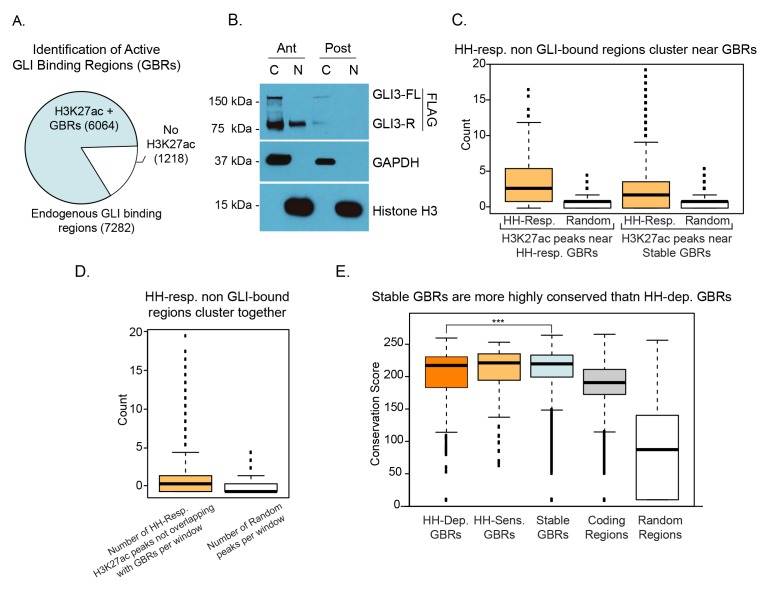
Figure 1. Hedgehog signaling regulates acetylation of H3K27 at a subset of GLI binding regions.
(A) Pipeline for identifying different categories of GLI bound regions (GBRs). (B) Heatmap depicting differential H3K27ac enrichment in WT over Shh-/- limb buds for HH-responsive and Stable GBRs. (C) Classification of GBR categories from E10.5 GBRs with H3K27ac in WT limbs. (D-F). H3K27ac enrichment in WT and Shh -/- is shown across a representative genomic region near a Stable GBR (D), and biologically validated HH-responsive GBRs: a HH-dependent GBRs, GRE1, at the HH target gene Gremlin 1 (Grem1) (Li et al., 2014) (E) and HH-sensitive GBRs shown to regulate limb-specific expression of the HH target Ptch1 (Lopez-Rios et al., 2014) (F). (G) HH-dependent GBRs, HH-responsive GBRs and Stable GBRs are significantly enriched (2 kb upstream- 1 kb downstream of TSS) near HH target genes compared to randomly chosen genes (p=0, p=0 and p=0, respectively, permutation test based on 1000 permutations). (H) Proportional distribution of Stable and HH-responsive GBRs arounds transcription start sites (TSS), indicating significant enrichment of Stable GBRs at TSS compared to HH-responsive GBRs (p=2.55e-40, Fisher's exact test, two sided). (I) Both HH-dependent and HH-sensitive GBRs have significantly more GLI motifs than Stable GBRs (top)(p=2.2e-16 and p=8.00e-06; one-sided proportional test). HH-dependent and HH-sensitive GBRs containing GLI motifs have significantly higher quality of GLI motifs than Stable GBRs (Quality score; p=5.03e-13 and p=5.98e-08; one-sided Wilcoxon test) and significantly more motifs per GBR within HH-dependent GBRs than Stable GBRs (Quantity score; p=5.92e-06; one-sided Wilcoxon test). See Figure 1—figure supplement 1, Figure 1—source data 1, Figure 1—source data 2, Figure 1—source data 3, Figure 1—source data 4.


