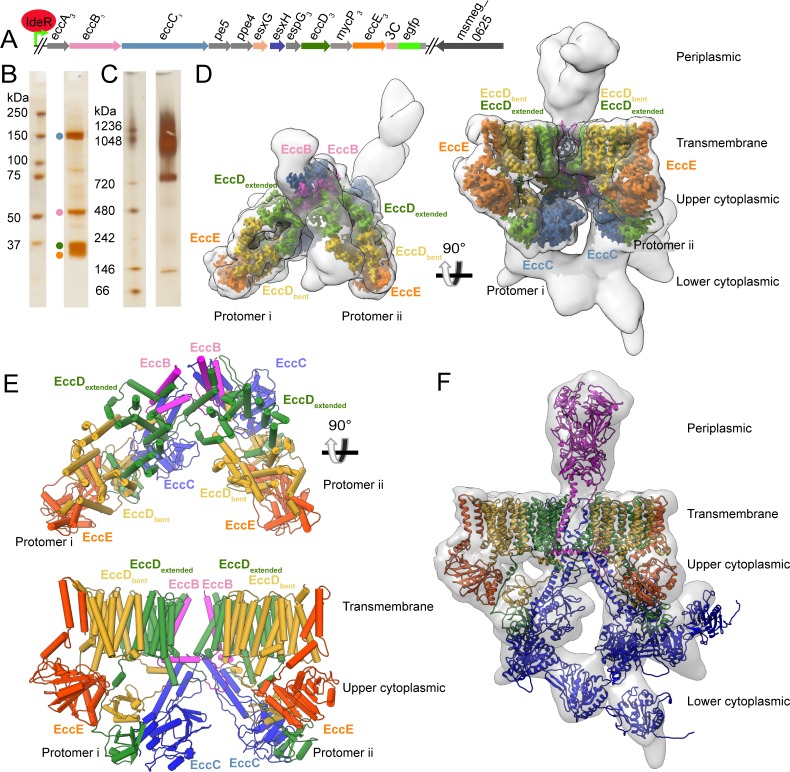
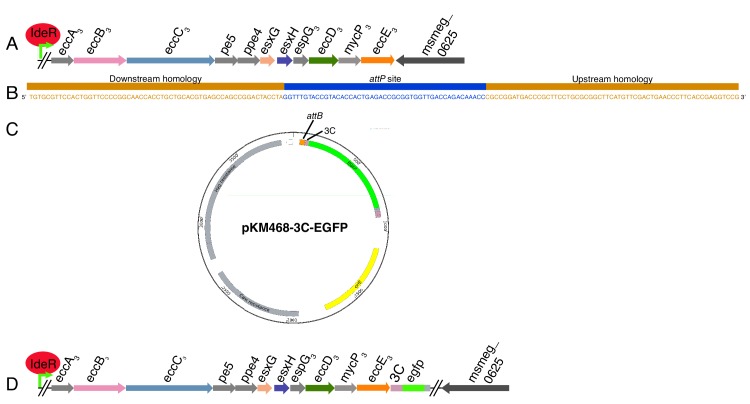
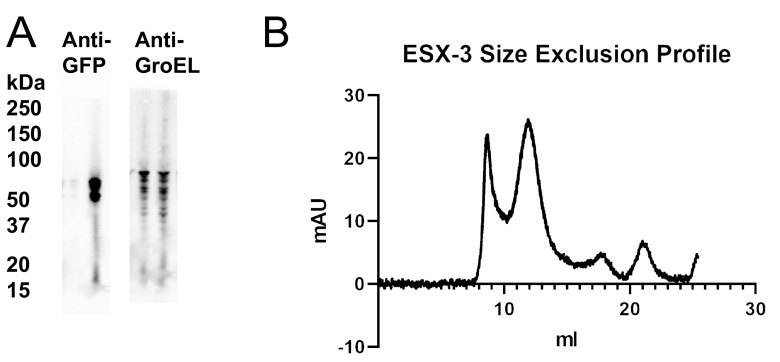
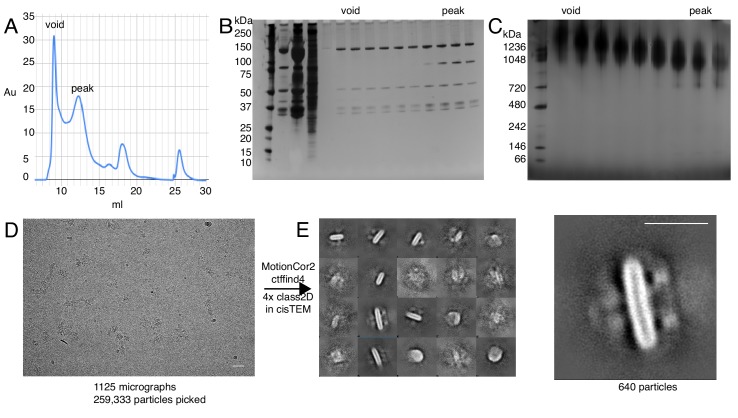
Figure 1. Overview of the ESX-3 tagging, purification, and structure.
(A) The ESX-3 operon in M. smegmatis and the placement of the purification tag. Genomic deletion of ideR derepresses ESX-3 to boost expression for purification. (B) SDS-PAGE of purified ESX-3 shows four major bands corresponding to EccB3, EccC3, EccD3, and EccE3. (C) Blue native page of the purified ESX-3 complex shows a large molecular weight band around 900 kDa. (D) Merged maps of all focused refinement maps (gray transparency) of the ESX-3 dimer filtered to 10 Å resolution. The transmembrane and upper cytoplasmic focused maps (3.7 Å) are segmented by subunit showing one copy per protomer of EccB3 (pink), EccC3 (blue), EccE3 (orange), EccD3-bent (yellow), and EccD3-extended (green). (E) Atomic models of the transmembrane and upper cytoplasmic regions. (F) A combined map of the full complex filtered to 10 Å resolution (gray transparency) with full models for each protein, EccD3-bent (yellow), EccD3-extended (green), EccE3 (orange), EccC3 (blue), and EccB3 (pink).

