. 2019 Dec 30;8:e52983. doi: 10.7554/eLife.52983

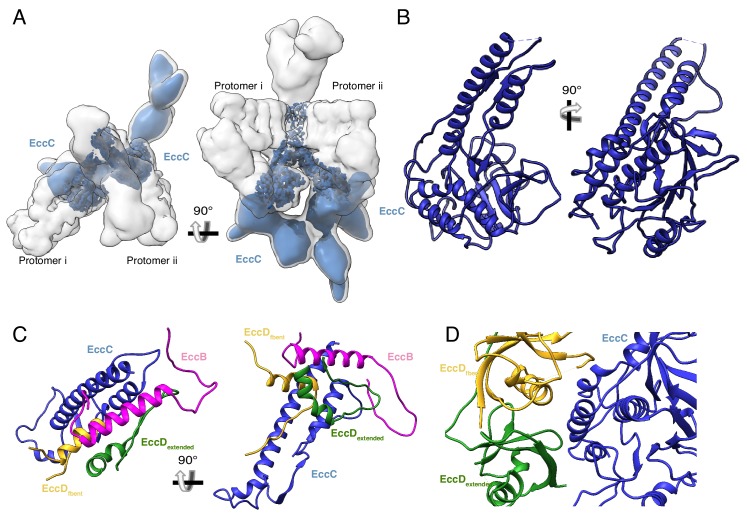
Figure 4. The structure and protein-protein interactions of EccC3.

(A) The placement of EccC3 in the overall ESX-3 dimer. (B) Atomic model of the EccC3 DUF (C) The stalk helices of EccC3 interact with EccB3, EccD3-bent, and EccD3-extended (D) Interactions between EccC3 and the ubiquitin-like domains of EccD3-bent and EccD3-extended in the cytoplasm.

Figure 4.

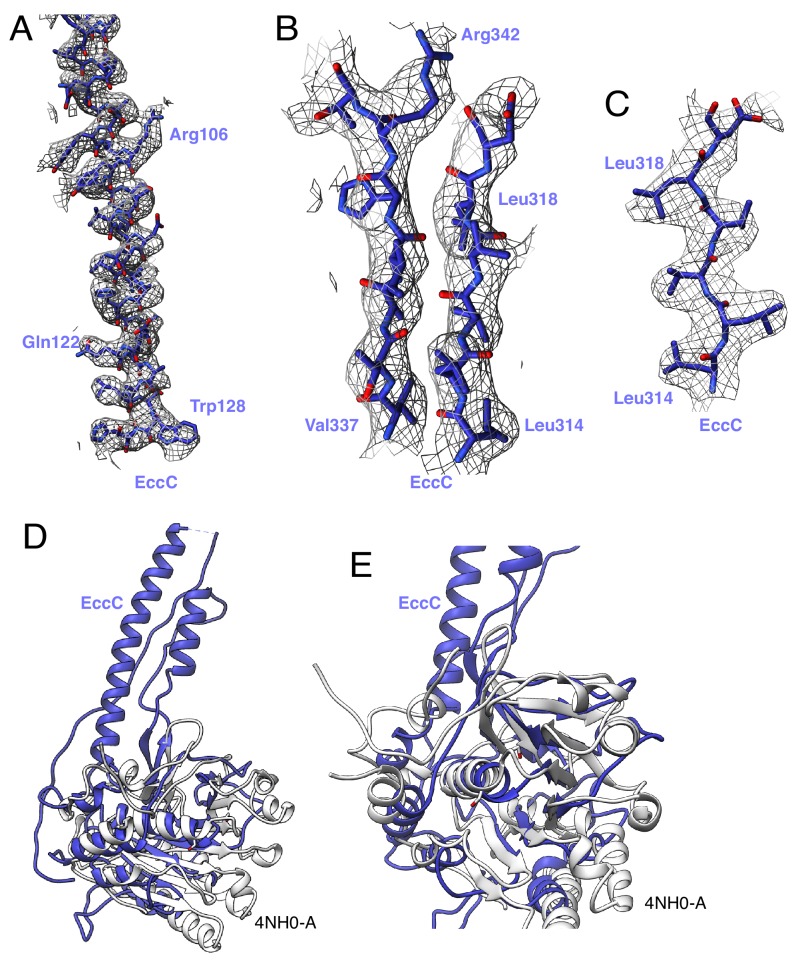
Figure 4—figure supplement 1. EccC3 map and model.

Figure 4—figure supplement 1.

(A) Map and model of the EccC DUF domain, amino acids amino acids 97 to 130. (B) Two beta strands in the EccC DUF domain, amino acids 314 to 319 and 337 to 343. (C) Beta strand in the EccC DUF domain, amino acids 314 to 319. (D) Overlay of the model of the EccC DUF domain with the top DALI hit, 4NH0-A (white). (E) Close up of the ATP binding pocket of 4NH0-A. The ATPase fold remains intact in the DUF domain.
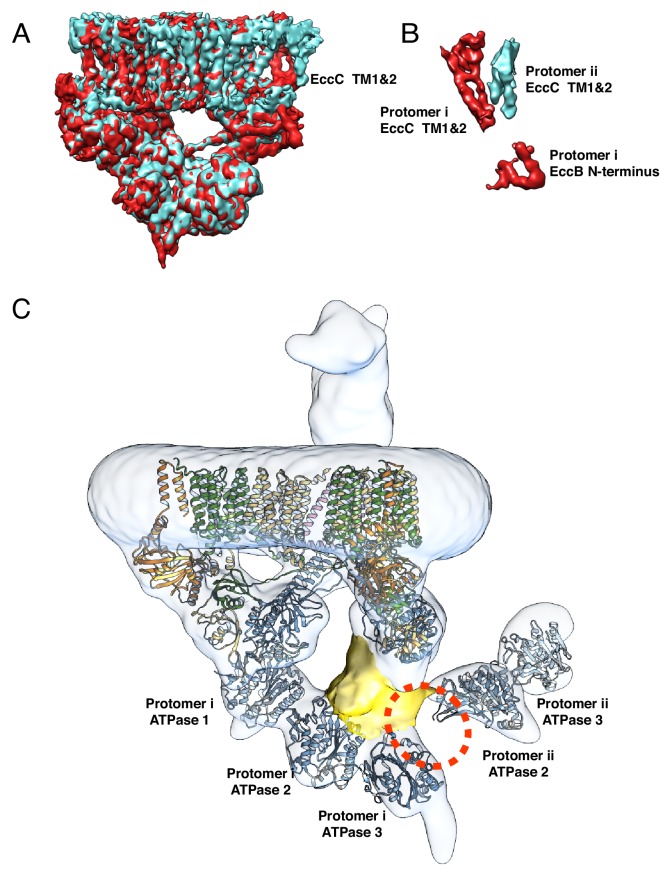
Figure 4—figure supplement 2. Conformational differences between protomer i and protomer ii.

Figure 4—figure supplement 2.

(A) Overlay of the focused refined maps of the transmembrane and upper cytoplasmic regions of protomer i (red) and protomer ii (blue). The two protomers are nearly identical except in the transmembrane domains of EccC3 and the N-terminal tail of EccB3. (B) Density subtraction of the two protomers in A highlights the regions of difference. Specifically, the transmembrane helixes of EccC3 adopt distinct conformations across protomers. (C) In protomer i, 4NH0, the crystal structure of EccC from T. curvata, fits well in the density. In protomer ii, ATPase 2 and 3 fit well into the density but the position of ATPase 1 in the crystal structure, shown by the red dotted circle, does not fit into the density. A density of about the right size for ATPase 1 is shown in yellow. Fitting of ATPase 1 in this density requires the disruption of the interface between ATPase 1 and ATPase 2.