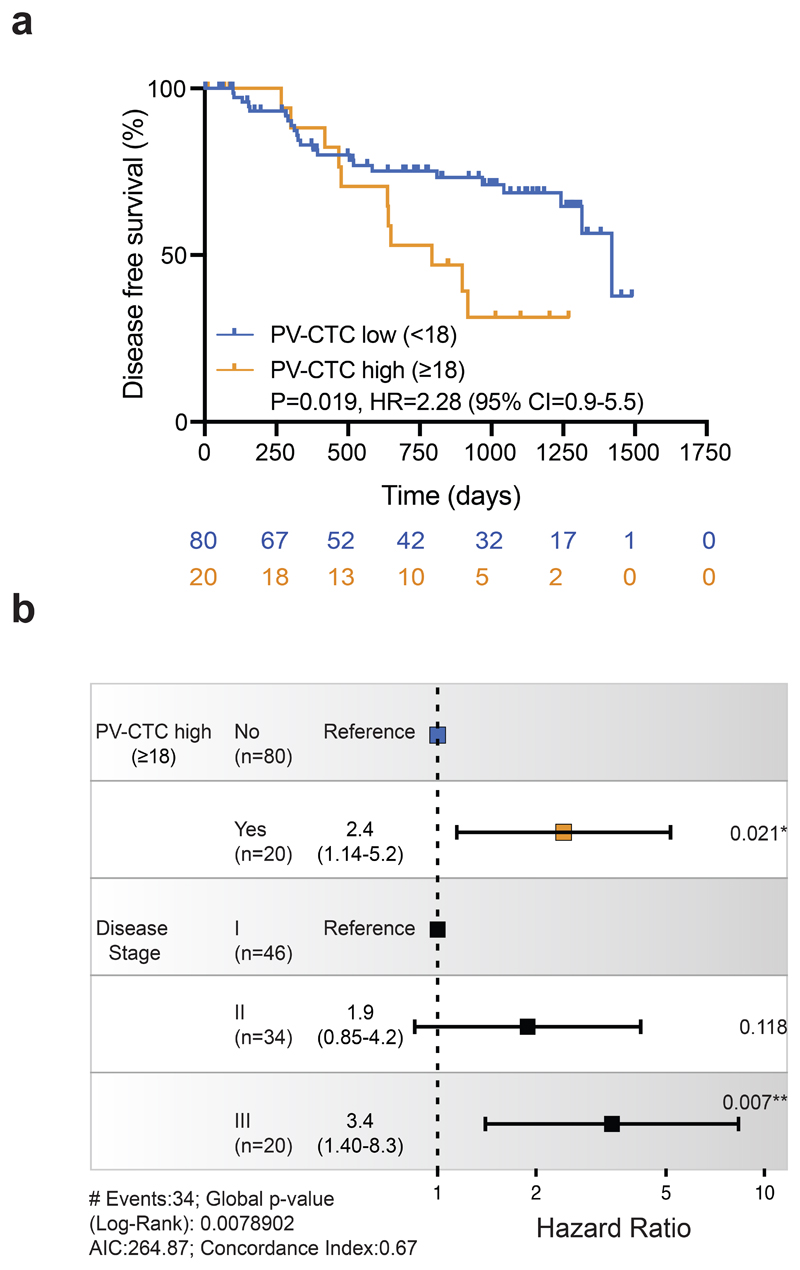
Fig.2. PV-CTCs as independent predictors of disease-free survival.
a, Kaplan–Meier curves showing disease-free survival (DFS) of 100 patients stratified as PV-CTC high or low based on the previously published threshold from our pilot study (≥18 PV-CTCs/7.5ml blood)11. The number of patients at risk for every time point is indicated below the time point and colour coded according to the high or low groups. P value, HR and relative 95% confidence intervals (CI) (two-sided log-rank test) are indicated. b, Forest plot showing the results of multivariable regression analysis for PV-CTC high or low patients (≥18 PV-CTCs/7.5ml blood). The x-axis represents the hazard ratio with the reference line (dashed) and significance is calculated using a Cox proportional hazards model. The estimated hazard ratios and their 95% CI are presented as error bars. The log-rank test used was two-sided.

