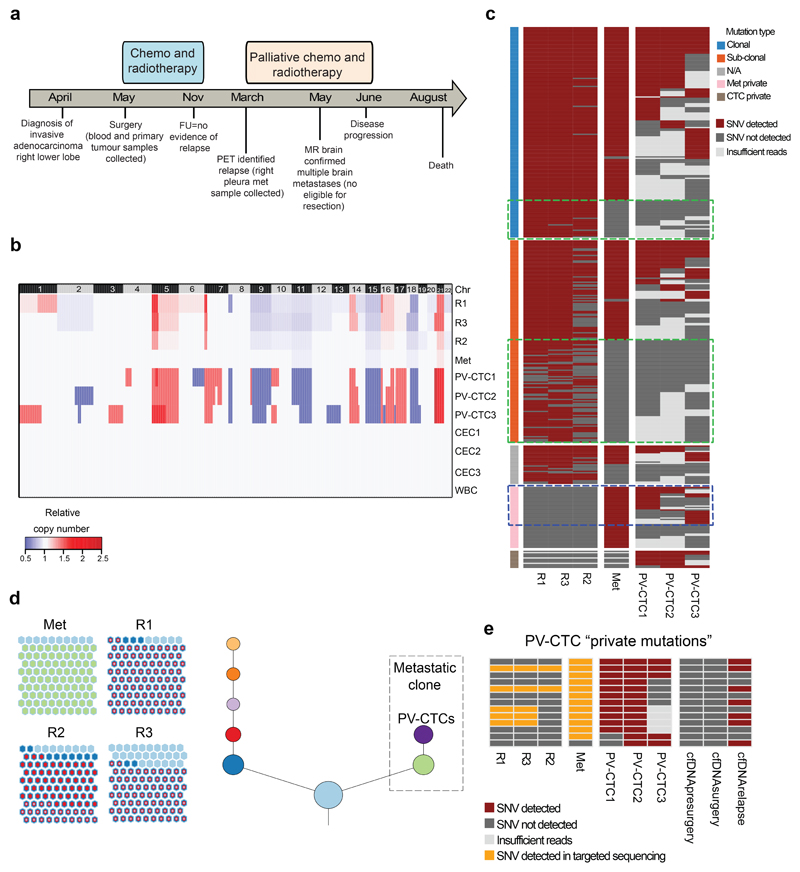
Fig.3. Mutations present in the relapse tumour are detected 10 months earlier in PV-CTCs and not in the primary tumour.
a, Patient timeline from diagnosis to death (FU=follow up; PET=positron emission tomography; MR=magnetic resonance). b, Heat map showing the comparison between CNA detected in PV-CTCs or circulating epithelial cells (CECs), in primary tumour regions (R1-3), in relapse tumour (Met) and in a WBC control. Regions of loss are coloured blue, regions of gain are coloured red. Chromosomes are indicated at the top of the figure. c, Heat map showing the comparison of SNVs detected in PV-CTCs, primary tumour regions and the metastasis. Mutations are ordered according to their clonality as established by primary tumour analysis. Green dashed boxes indicate mutations that are seen in the primary tumour, but not metastasis or PV-CTCs. Blue dashed box indicates the overlap between mutations considered metastatic private by primary tumour analysis and PV-CTCs. No mutations were found in the three CECs and two WBCs. d, Evolutionary tree encompassing tumour and PV-CTCs: the relationships between identified subclones is depicted, with size of circle reflecting the number of mutations in each subclone relative to largest. Length of lines connecting tumor subclones does not carry information. The beehive plots indicate the subclonal architecture of each tumour region, with 100 representative cells shown for each region and the nested colours corresponding to the ancestry of each cell. e, Heat map showing PV-CTC private mutations that are detected in primary tumour, metastasis and cfDNA following targeted deep sequencing.

