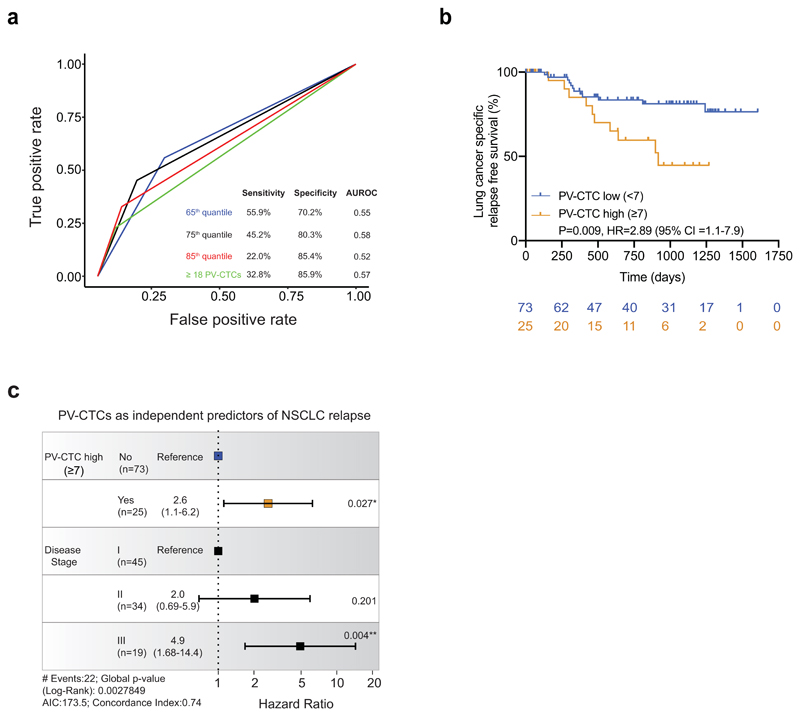
Extended Data Fig.1.
a, Time-dependent receiver operating characteristic (ROC) curves showing true positive and false positive rates for the 65th, 75th, 85th PV-CTC quantiles (≥3, ≥7 and ≥39 PV-CTCs/7.5ml blood respectively) alongside the previously published threshold from our pilot study (≥18 PV-CTCs/7.5ml blood)11. All predictions were made at 720 days. Sensitivity and specificity of each category is shown along with area under ROC curve (AUROC) value. b, Kaplan–Meier curve showing lung cancer specific relapse free survival for 98 patients stratified as PV-CTC high or low according to the 75th quantile (≥7 PV-CTCs/7.5ml blood). The number of patients at risk for every time point is indicated below the time point and colour coded according to the high or low groups. P value, HR and relative 95% confidence intervals (CI) (two-sided log-rank test) are indicated. c, Forest plot showing the results of multivariable regression analysis for PV-CTC high or low patients (≥7 PV-CTCs/7.5ml blood). The x-axis represents the hazard ratio with the reference line (dashed) and significance is calculated using a Cox proportional hazards model.

