Extended Data Fig.2.
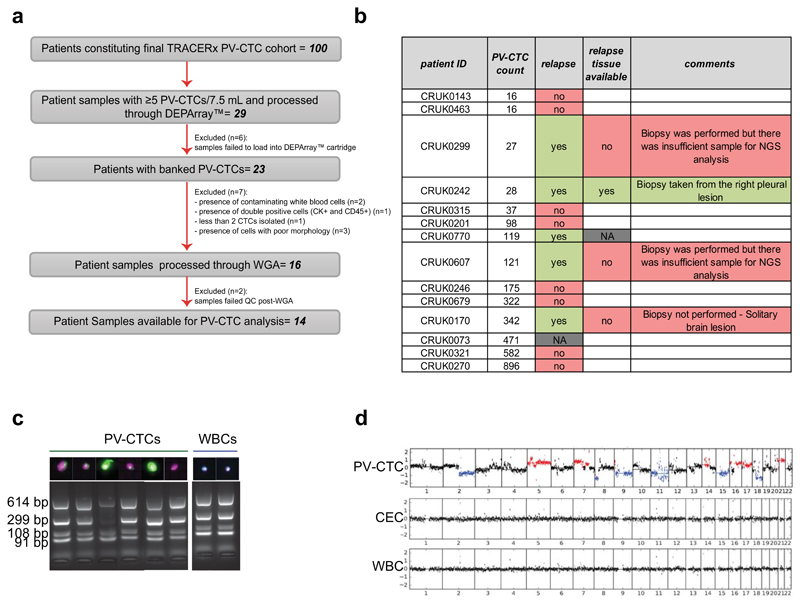
a, Consort diagram describing samples used for downstream analysis. Only patients with ≥5 PV-CTCs (29) were processed through single cell isolation (DEPArray™). Single cells were not isolated from 6 out of the 29 samples due to failures during sample loading into the DEPArray™ machine. From the remaining 23 samples, 7 patients whose single CTCs isolated did not meet morphology criteria (see methods) were excluded. 16 samples were processed for whole genome amplification (WGA) and 2 patients whose CTCs did not show good quality genomic integrity index in QC post-WGA were removed (see methods). b, Table showing cases of relapse among the patients with single PV-CTCs isolated. c, Agarose gel showing results of a QC–PCR assay used to determine the genome integrity of each sample. 0–4 bands determine the overall DNA integrity of each sample. DEPArray images of corresponding PV-CTC (cytokeratin (CK)+ stained green, CD45+ stained blue, DAPI+ stained purple) are shown above. d, Examples of copy number profiles detected in single PV-CTCs, CECs and WBC control. Blue and red indicate regions of copy number loss and gain respectively.

