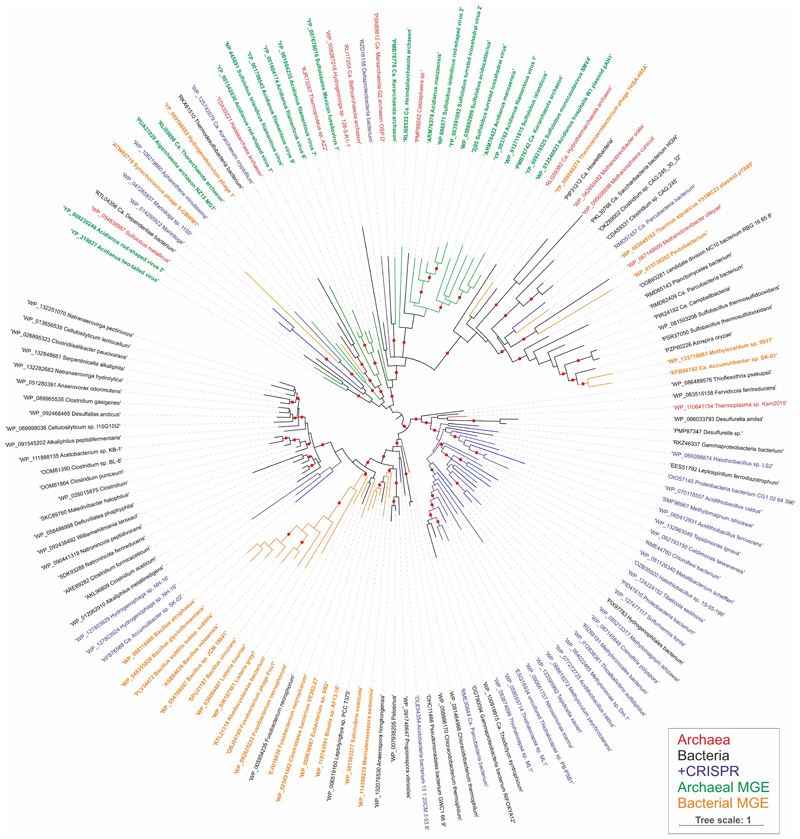
Extended Data Figure 7. Maximum likelihood phylogeny of AcrIII-1 homologs.
The maximum likelihood phylogenetic tree was constructed with the automatic selection of the best-fit substitution model for a given alignment (LG +G+I). Red circles indicate 95-100% branch support, as assessed using aBayes implemented in PhyML. The scale bar represents the number of substitutions per site. Branches and labels are colour coded: archaea, red; bacteria, black; bacteria and archaea in which AcrIII-1 homologs are associated with CRISPR loci, blue; archaeal viruses and plasmids, green; bacteriophages, orange.

