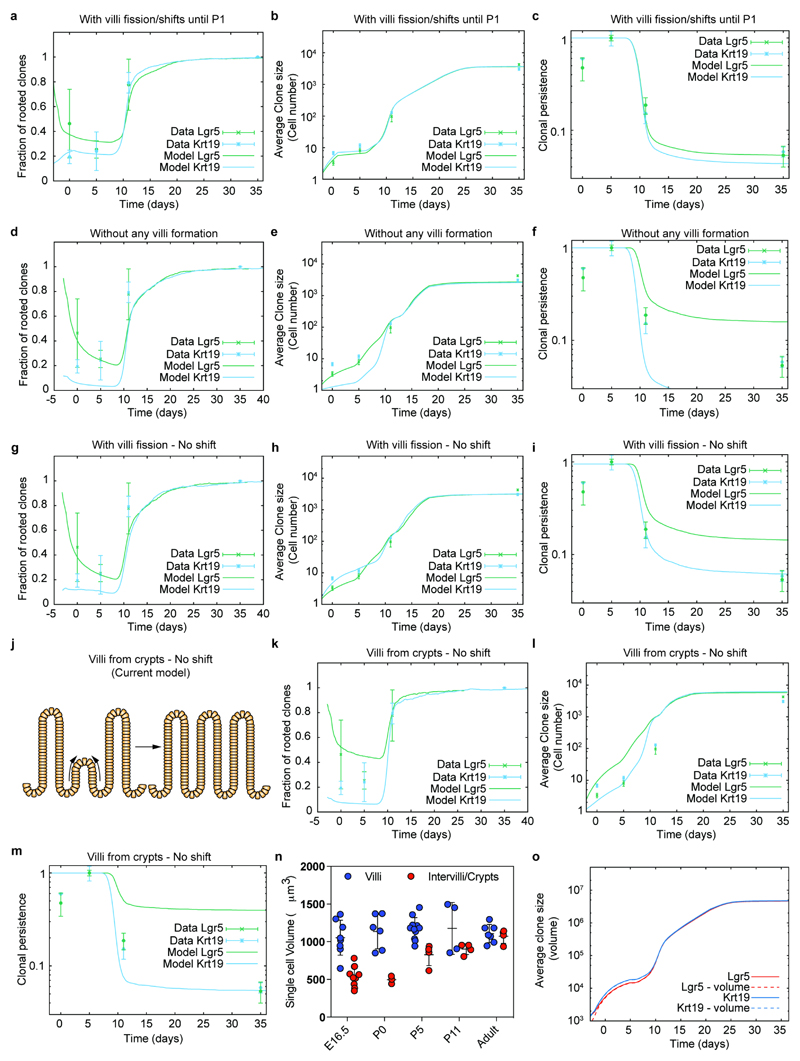
Extended Data Figure 7. Theoretical controls and sensitivity analysis.
a-c) Comparison between experimental data (dots and error bars) and theoretical predictions (thick lines) for the time evolution of the clonal rootedness (a), average clone size (b) and clonal persistence (c), both for the Krt19 (cyan) and the Lgr5 (green) tracings from E16.5. Here, the theoretical prediction corresponds to the case of villi fission, following exactly the same model in extended data Figure 6, but stopping at P1 instead of at P5. This shows that fetal fission is enough to explain the bulk of the equipotency between Lgr5 and Krt19 clones.
d-f) Comparison between experimental data (dots and error bars) and theoretical predictions (thick lines) for the time evolution of the clonal rootedness (d), average clone size (e) and clonal persistence (f), both for the Krt19 (cyan) and the Lgr5 (green) tracings from E16.5. Here, the theoretical prediction corresponds to the case of no new villi formation occurring, showing a very poor fit for the clonal persistence and size to the data. g-i) Comparison between experimental data (dots and error bars) and theoretical predictions (thick lines) for the time evolution of the clonal rootedness (g), average clone size (h) and clonal persistence (i), both for the Krt19 (cyan) and the Lgr5 (green) tracings from E16.5. Here, the theoretical prediction corresponds to the case of villi fission occurring as in the model of Figure 3, but without shift of cells upon villi fission (see schematics of Extended Data Figure 5), showing a very poor fit for the clonal persistence to the data.
j) Cartoon illustrating that current vilification model suggests that villi emerge from the intervillus region.
k-m) Comparison between experimental data (dots and error bars) and theoretical predictions (thick lines) for the time evolution of the clonal rootedness (k), average clone size (l) and clonal persistence (m), both for the Krt19 (cyan) and the Lgr5 (green) tracings from E16.5. Here, the theoretical prediction corresponds to the case of villi formation occurring only from existing crypts, showing a very poor fit for the clonal persistence to the data.
n) Single cell volume of villi cells and intervillus/crypts cells. Total E-Cadherin volume of villi and intervilli/crypts and subsequently divided by the number of DAPI positive nuclei to estimate the single cell volume. E16.5 villi n=8, E16.5 intervilli n=10, P0 villi n=6, P0 intervilli n=3, P5 villi n=11, P5 intervilli n=4, P11 villi n=4, P11 intervilli n=4, Adult villi n=7, Adult intervilli n=4 independent pictures were analyzed.
o) Sensitivity analysis on the influence of differential Lgr5- and Lgr5+ cellular volume on the model prediction (considering either that all cells have the same volume, continuous lines and panels a-n, or the differential volume measured at E16.5 in Supplementary theory note, dashed lines).
For panels a-i,k-m, P0 n=3, P5 n=3, P11 n=3, Adult n=6 independent samples were analyzed for Lgr5, P0 n=1; P5 n=3, P11 n=6, Adult n=3 independent samples for Krt19. Error bars indicate the mean±S.E.M.

