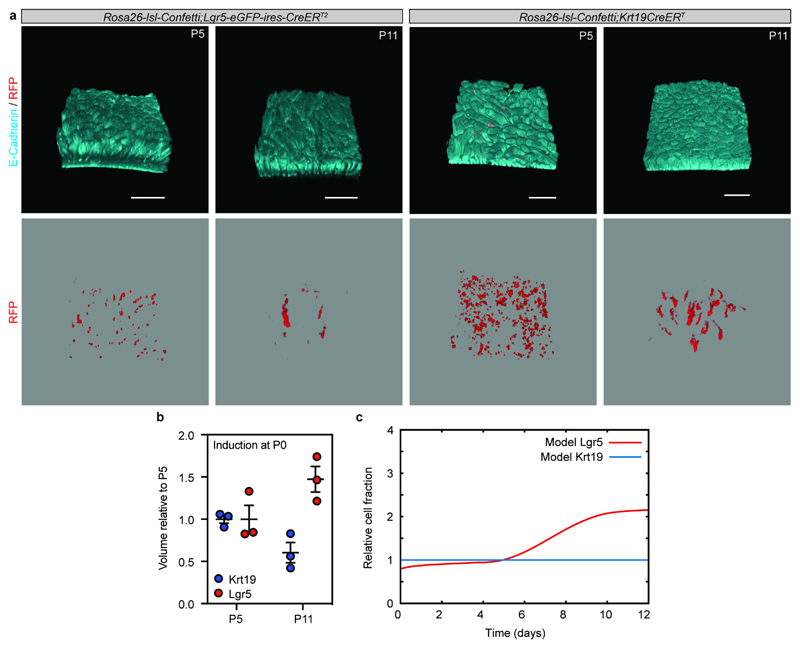
Extended Data Figure 8. Postnatal lineage tracing.
a) Detection of E-Cadherin (Cyan) and clones (Red) induced at P0 either randomly (Krt19CreERT) or in the intervillus region (Lgr5-eGFP-ires-CreERT2). Samples from 3 animals were analyzed per time point and representative images are shown.
b) Relative volume of clones (projected) induced either randomly (Krt19CreERT) or in the intervillus region (Lgr5-eGFP-ires-CreERT2) as assessed by quantitative clonal analysis following induction at P0. Samples from 3 animals were analyzed per time point and dots represent individual samples and lines indicate the mean±S.E.M.
c) Theoretical labelled cell fraction of the Lgr5 clones induced at P0, using the same model dynamics as the E16.5 induction. Expansion of the Lgr5 clones is represented by the thick red line, normalized by the Krt19 tracing (blue, indicative of global tissue growth), and normalized by its P5 value. This displays a net two-fold increase between P5 and P11, consistent with the results of the experimental P0 tracing.

