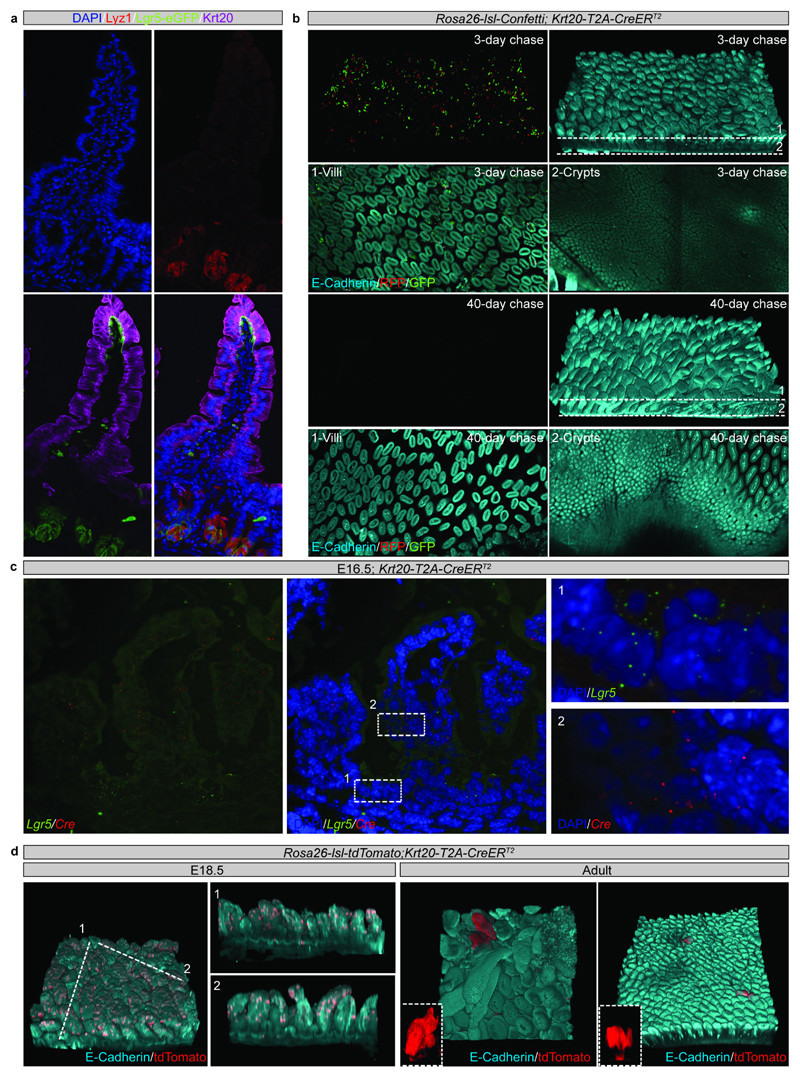
Extended Data Figure 9. The contribution of Krt20 expressing cells during development and homeostasis.
a) Detection of Keratin 20 (Krt20, magenta), Lysozyme1 (Lyz1, red) and GFP (Lgr5-DTR-eGFP) in adult mouse intestine. Tissue is counterstained with DAPI (cyan). Representative picture of n=3 biologically independent samples is shown.
b) Detection of E-cadherin (E-cad, cyan), GFP (green) and RFP (red) in tissue whole mounts from the proximal part of the small intestine isolated from Rosa26-lsl-Confetti/Krt20-T2A-CreERT2 animals at 3- and 40-days post label induction with 4-hydroxytamoxifen. Samples from 3 animals were analyzed per time point and representative images are shown.
c) In situ hybridization of Lgr5 (Green) and Cre (Red) at E16.5 in proximal E16.5 small intestine. Tissue is counterstained with DAPI (cyan). Samples from 3 animals were analyzed per time point and representative images are shown.
d) Detection of E-cadherin (E-cad, cyan) and tdTomato (red) in tissue whole mounts from the proximal part of the small intestine isolated from Rosa26-lsl-tdTomato/Krt20-T2A-CreERT2 animals at E18.5 and adulthood following administration of 4-hydroxytamoxifen at E16.5. Representative pictures of n=2 samples are shown.

