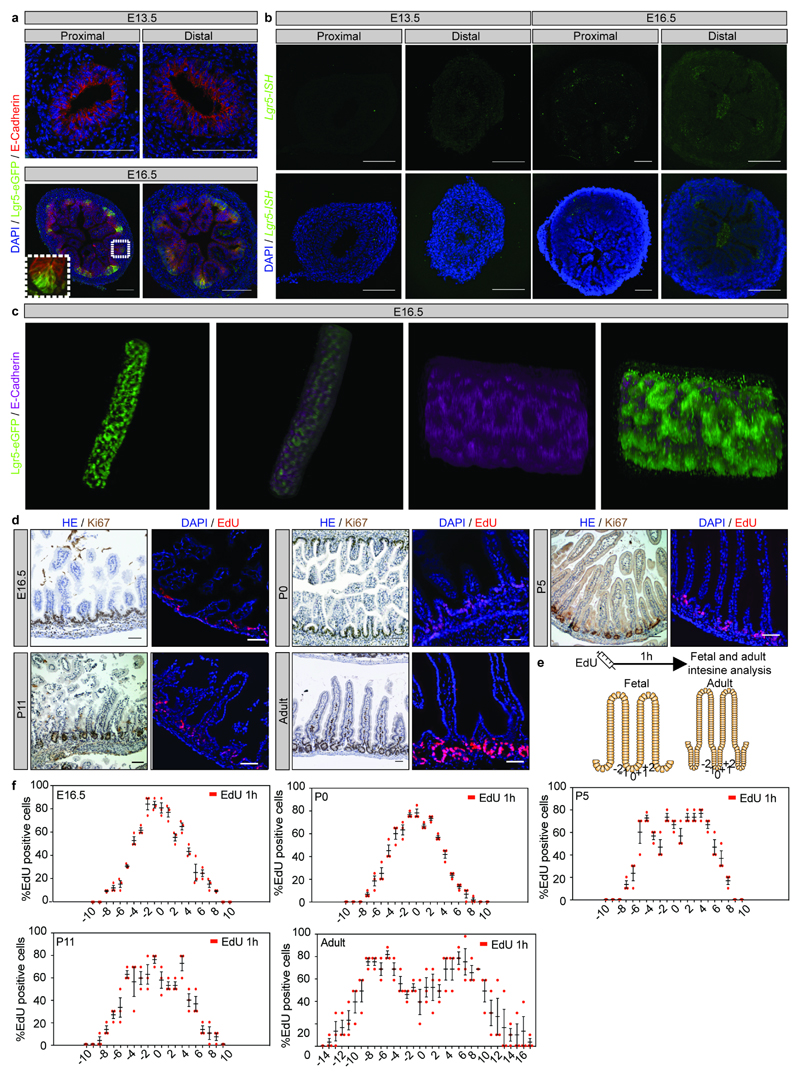
Extended Data Figure 1. Lgr5 positive cells and proliferative cells are restricted to the intervillus regions.
a) Detection of E-Cadherin (red) and GFP (Lgr5-DTR-eGFP) at E13.5 and E16.5 in proximal and distal small intestine. Tissue is counterstained with DAPI (cyan). A representative picture from each time point and intestinal segment is shown (n=3 animals analyzed).
b) In situ hybridization of endogenous Lgr5 at E13.5 and E16.5 in proximal and distal small intestine. Tissue is counterstained with DAPI (cyan). A representative picture of at each time point and intestinal segment is shown (n=3 animals analyzed).
c) Detection of E-cadherin (magenta) and GFP (Lgr5-DTR-eGFP) in intestinal whole-mount at E16.5 in proximal small intestine. A representative picture from n=3 independent samples is shown.
d) Detection of Ki67 and EdU (red) following a 1-hour pulse at the indicated time points (left and right panels, respectively). Three animals were analyzed at each time point and a representative picture is shown. Scale bars: 50μm.
e-f) Quantification of number and location of EdU+ cells as depicted (e) from at least 10 intervillus regions per mouse at E16.5, P5, P11, Adult, and 20 intervillus regions per mouse at P0 up to position 10 and position 17 (adult). Samples from three animals were analyzed at each time point. Bars represent the mean + S.E.M.

