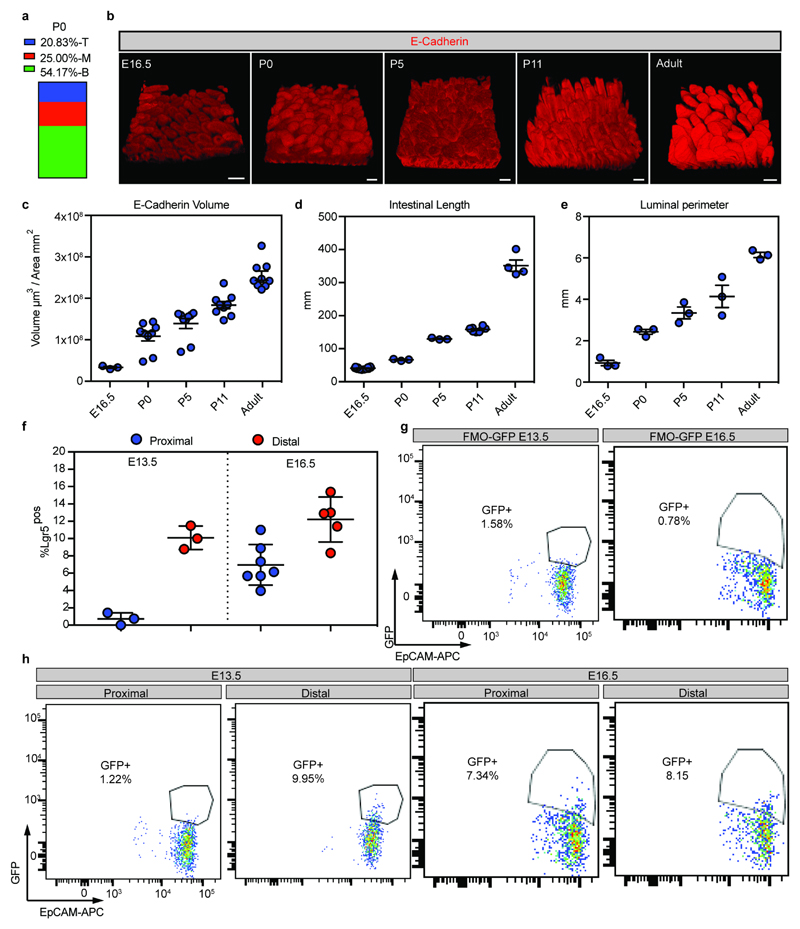
Extended Data Figure 2. Lgr5-derived clones are located in intervillus regions and qualitative/quantitative morphological analysis of the intestine from fetal to adult stages.
a) Quantification of the localization of labeled clones at P0 following labeling at E16.5 in Rosa26-lsl-Confetti/Lgr5-eGFP-ires-CreERT2 animals. Villi containing clones were divided in three equal regions (T: top, M: mid, B: bottom) based on the z-projections in the 3D to determine the clone localization at P0 (n=24 clones).
b) Detection of E-cadherin (red) in whole mounts at the indicated time points. Scale bars: 100μm. A minimum of three animals were analyzed at each time point and representative pictures are shown (E16.5 n=3, P0 n=9, P5 n=9, P11 n=9, Adult n=9 independent animals)
c) Measurements of the total epithelial volume/unit area based on detection of E-cadherin relative to the area of the intestine was assessed (samples from b). Dots represent independent biological samples and lines represent the mean±S.E.M.
d) Length of the small intestine at E16.5 (n=12), P0 (n=3), P5 (n=3), P11 (n=8) and Adult (n=4). Dots represent individual animals and lines represent the mean±S.E.M.
e) Luminal perimeter of the small intestine at E16.5, P0, P5, P11 and Adult. Dots represent individual animals (n=3) and lines represent the mean±S.E.M.
f-h) Quantification of GFP as a proxy of Lgr5 in proximal and distal small intestine at E13.5 (n=3 animals both proximal and distal) and E16.5 (n=7 animals proximal and n=5 animals distal) small intestines (f). Fluorescence minus one (GFP) controls used to establish the positive gates are shown in (g). h) Representative FACS dot plot illustrating the gating strategy to quantify the size of the Lgr5-DTR-eGFPpositive population (Gate: DAPInegCD31negCD45negEpCAMpos). Dots represent measurement in individual animals and lines represent the mean±S.E.M.

