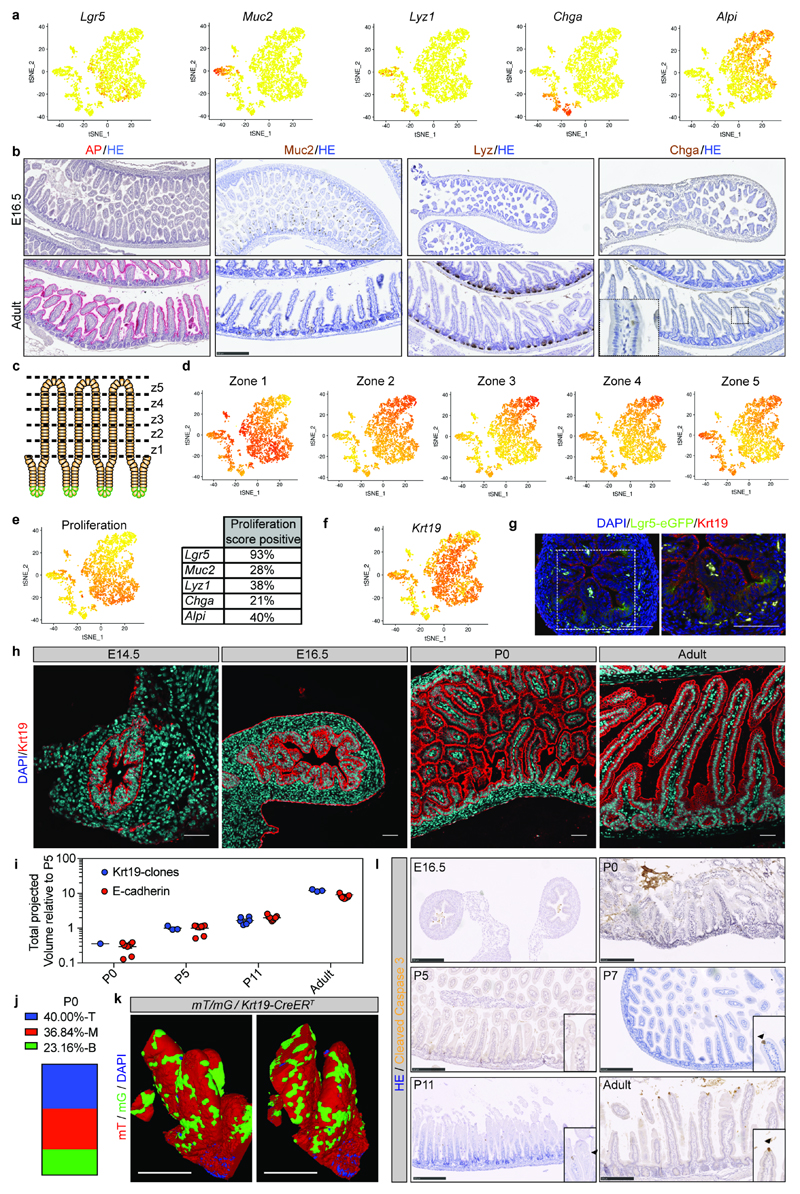
Extended Data Figure 3. Characterisation of the fetal small intestinal epithelium.
a) tSNE plots from sc-RNAseq of epithelial cells from the proximal small intestine showing expression of ISC (Lgr5) and differentiation markers (Muc2, Lyz1, ChgA, Alpi). Darker color indicates higher normalized gene expression. Each dot represents independent cells, a total of 3509 cells are shown.
b) Detection of differentiation markers at E16.5 and adult small intestine. Tissue is counterstained with HE. Scale bars: 250μm. Samples from n=3 animals were analysed at each time point and representative images are shown.
c-d) (c) Cartoon depicting that adult villi are transcriptionally zonated in five regions from the bottom to the top (z: zone). (d) tSNE plots showing the enrichment of villi clusters in the sc-RNAseq from E16.5 small intestine.
e) tSNE plot showing the enrichment of a proliferation signature in specific cell populations (left panel) and fraction of cells in each subpopulation scoring positive for the proliferation gene signature (right panel). Darker color in tSNE plot indicates higher expression levels of the proliferation gene signature.
f) tSNE plot showing expression of Keratin 19 (Krt19). Darker color indicates higher normalized gene expression levels.
g) Detection of Krt19 (red) and GFP (Lgr5-DTR-eGFP) at E16.5 in proximal small intestine. Tissue is counterstained with DAPI (cyan). Scale bars: 50μm. Samples from three animals were analyzed and a representative picture is shown.
h) Detection of (Krt19, red) at different time points in tissue from the small intestine. Tissue is counterstained with DAPI (cyan). Scale bars: 50μm. Samples from three animals were analyzed per time point and representative pictures are shown.
i) Relative volume (projected) of Krt19-clones and epithelium based on E-Cadherin. E-Cadherin is also shown in Figure 1c and Krt19-clones are also shown in Figure 2. (Krt19-clones, biologically independent samples: P0 n=1; P5 n=3, P11 n=6, Adult n=3; E-Cadherin biologically independent samples: P0 n=9, P5 n=9, P11 n=9, Adult n=9)
j) Quantification of the localization of labeled clones at P0 following administration of 4-hydroxytamoxifen at E16.5 in Rosa26-lsl-Confetti/Krt19-CreERT animals. Villi containing clones were divided in three equal regions (T: top, M: mid, B: bottom) based on the z-projection in 3D to determine where clones were located at P0 (n=27).
k) Detection of GFP (green) and RFP (red) in whole mounts from the proximal part of the small intestine isolated from mT/mG/Krt19CreERT animals at P0 following induction at E16.5. A representative picture of n=3 biologically independent samples is shown. Scale bars: 25μm
l) Apoptotic cells were detected by cleaved caspase3. Arrowheads demarcate positive cells in inserts. Samples from 3 animals were analyzed per time point and representative pictures are shown. Scale bars: 250μm.

