
Figure 5.
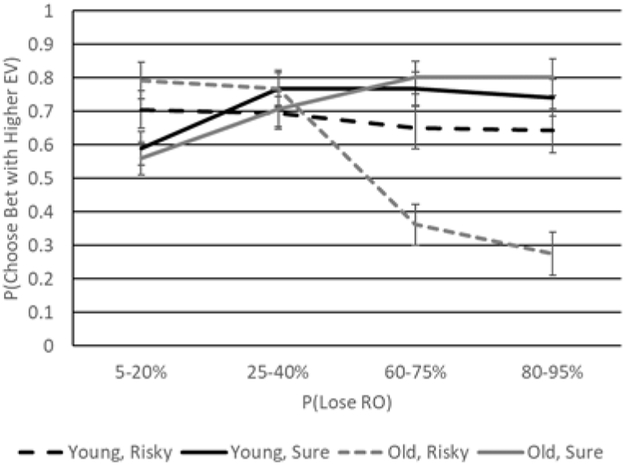
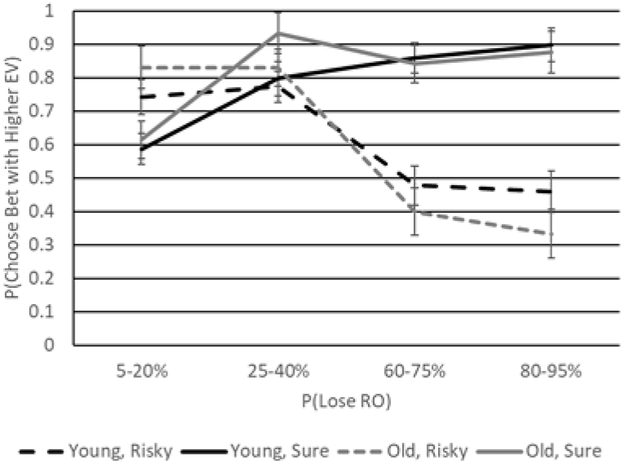
Choice probability as a function of age (black lines = young adults; gray lines = older adults), the probability associated with losing the RO when it had the higher EV, and pair type (dashed line = risky-risky pairs; solid line = risky-sure pairs) in women (A) and men (B). Error bars reflect standard errors.