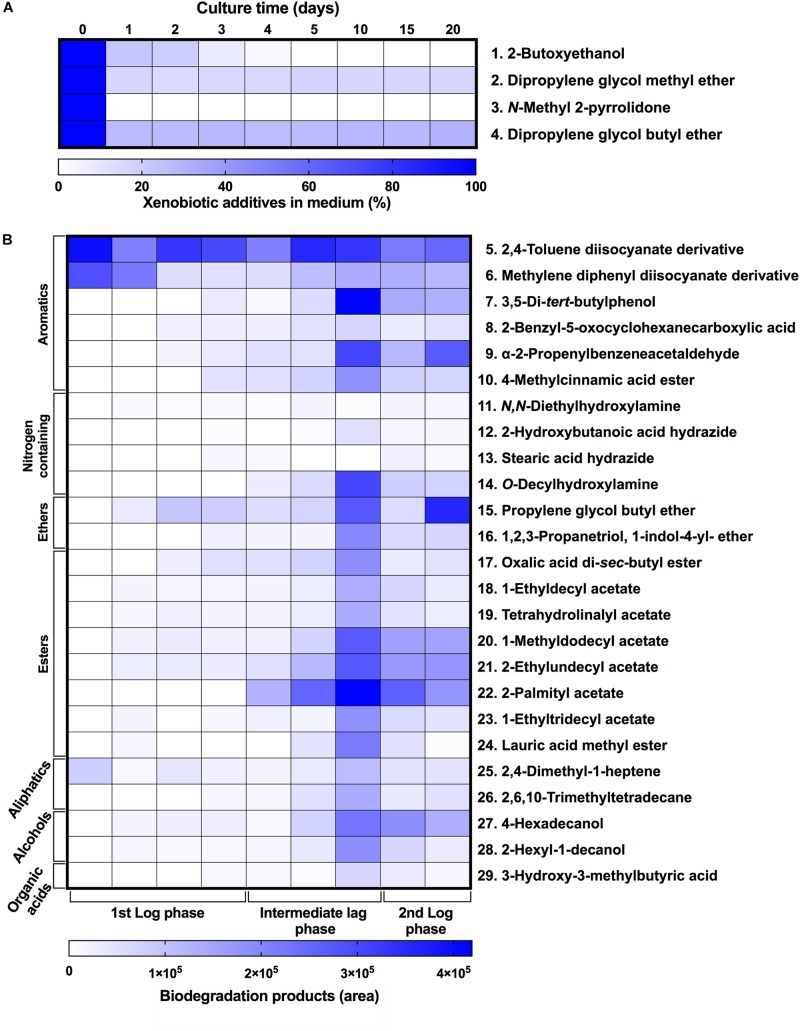
FIGURE 2.
Xenobiotic additives consumed (A) and PE-PU-A biodegradation products generated (B) by the BP8 community. Cell-free supernatants were extracted at different cultivation times with chloroform:methanol and analyzed by GC-MS. (A) Additives were quantified using standard curves for each compound and (B) biodegradation products by analyzing their areas in independent chromatograms. n = 3. Compounds with mass spectra similarity values over 700 were considered the same compounds of the Library hits. The numbers in the compounds correspond to signals in the chromatograms of Supplementary Figure S1.

