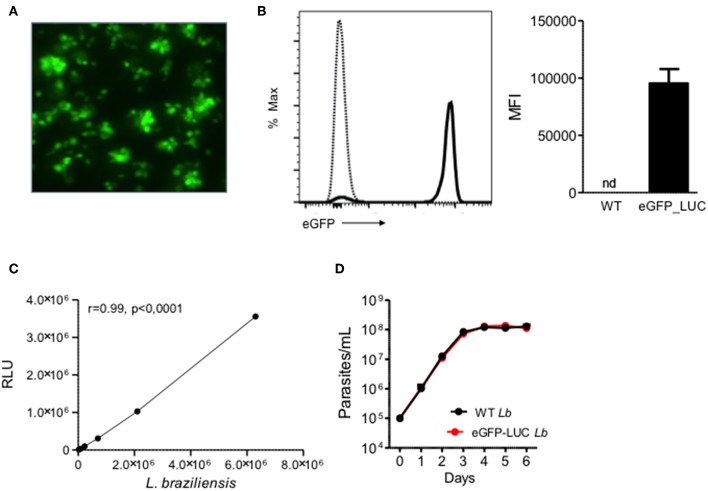
Figure 3.
Expression of eGFP and Luciferase in transgenic L. braziliensis. (A) Fluorescence microscopy of transgenic L. braziliensis (clone #7) promastigotes. (B) Representative histogram depicting eGFP in WT L. braziliensis (dotted line) and eGFP-LUC L. braziliensis (clone #7) (solid line), both shown as % of Max. Bar graph represents the MFI of WT and eGFP-LUC L. braziliensis. Data (mean ± SEM) are from a representative experiment. (C) Luminescence intensity and number of eGFP-LUC L. braziliensis promastigotes. Promastigotes were serially diluted and luminescence was measured using a microplate reader, after addition of luciferin. RLU, relative light units. (D) Growth curve of WT and eGFP-LUC L. braziliensis (clone #7). Parasites were cultures in supplemented Schneider medium and parasites numbers were determined daily using a hemocytometer. Data (mean ± SEM) are from a representative experiment, performed in quintuplicate. nd, not detected.

