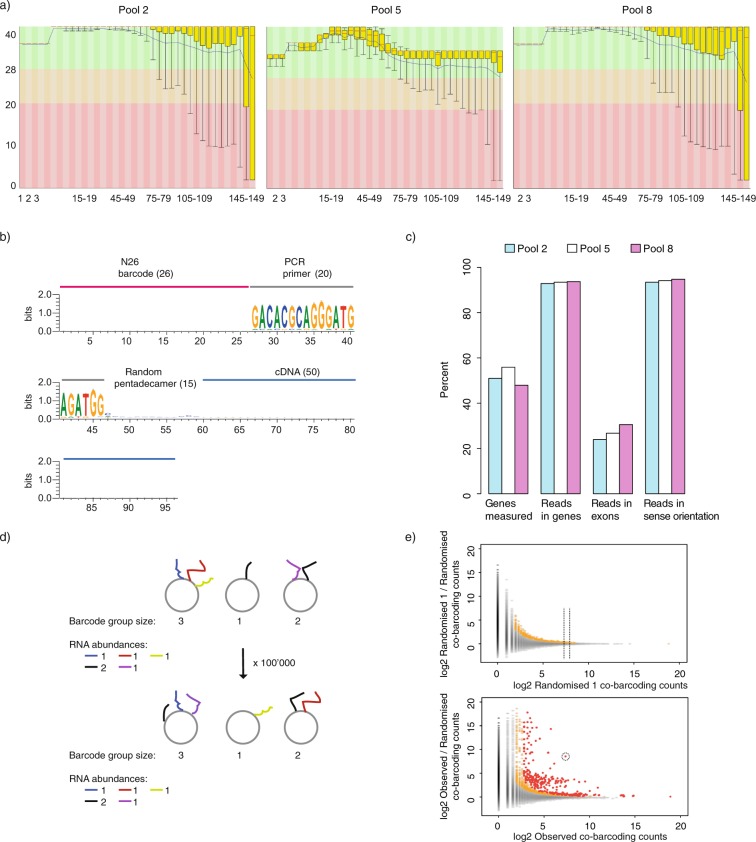
Fig. 2.
Quality of Proximity RNA-seq fragments, comparative read mapping statistics and randomisations. (a) Base calling quality scores (y axis) with background colours indicating very good (green), medium (orange) and poor (red) quality plotted against read position (x axis) using FASTQC (http://www.bioinformatics.babraham.ac.uk/projects/fastqc/). (b) Schematic of a sequenced Proximity RNA-seq library fragment with base distributions along raw fragment sequences. Of note, only 50 bases of the cDNA part were subsequently used to ensure the usage of high base quality scores. (c) Read mapping statistics for different datasets. (d) Randomisations of RNA proximities taking transcript-specific abundances and barcode group sizes on beads into account. (e) Plots of observed to randomized co-barcoding count ratios against observed co-barcoding counts. Each dot represents one RNA-RNA pairing. The top panel depicts the co-barcoding ratio of a randomised data set (randomised 1) to the average of all its randomisations, which provides a background distribution. The bottom panel shows the ratio of actual, observed co-barcoding to the average of all its randomisations. In both plots, pairwise RNA proximities with at least 2 observations were included and coloured in grey. Coloured in yellow are proximities with at least 3 observations and a local background-corrected p value <= 0.01, in red are proximities with at least 3 observations and a Benjamini-Hochberg corrected p value <= 0.05.

