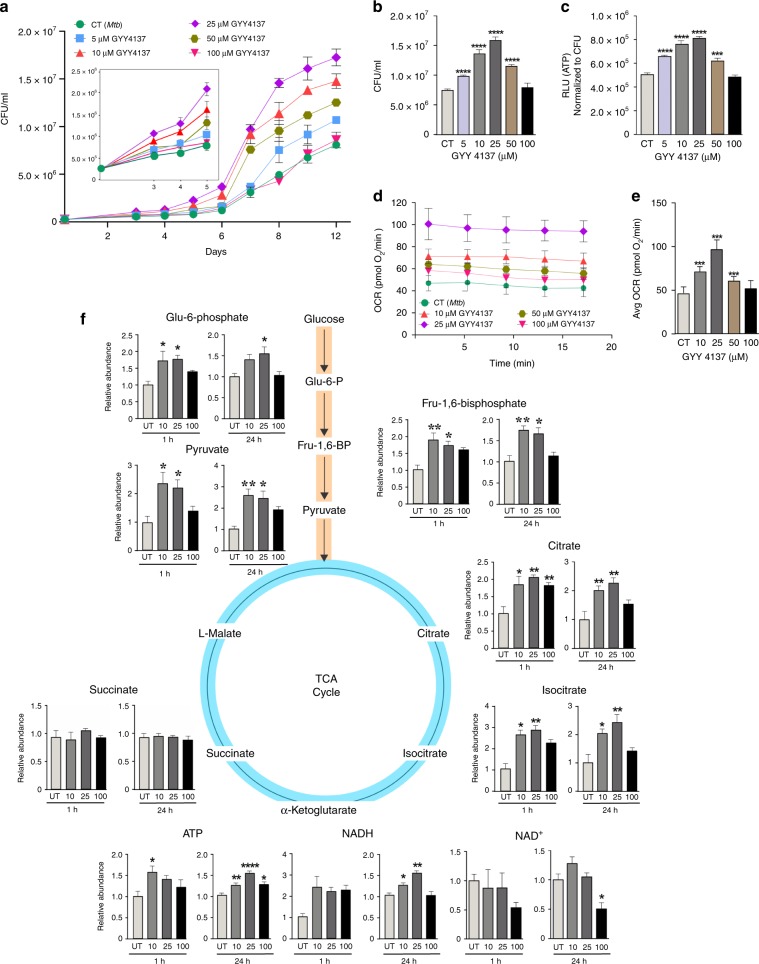
Fig. 2. GYY4137 modulates Mtb growth, bioenergetics and ATP production.
a CFU-based growth profile of Mtb following incubation with GYY4137. Inset shows early Mtb growth. b Mean CFU values at day 12 of the growth analysis. c ATP levels in Mtb following 24 h exposure to GYY4137. Data (a−c) are representative of at least two independent experiments. d OCR profile (n = 4−6) and e average OCR of Mtb exposed to GYY4137 (n = 20−30). Control (CT) groups in panels (a−e) received spent GYY4137. f LC-MS targeted metabolic analysis of Mtb with or without exposure to 10, 25 and 100 μM GYY4137 (for 1 or 24 h). Graphs show relative abundance (peak area) of metabolites in Mtb cells (n ≥ 3 per group). Data are shown as mean ± SD, except (b) and (f) (mean ± SEM). Data in (a) were analyzed using two-way ANOVA with Tukey’s multiple comparisons test, with day 12 data shown in (b), or one-way ANOVA (c−f) with Sidak’s multiple comparisons test. All statistical differences are relative to untreated controls. *P < 0.05, **P < 0.01, ***P < 0.001, and ****P < 0.0001. Source data are provided as a Source Data file.

