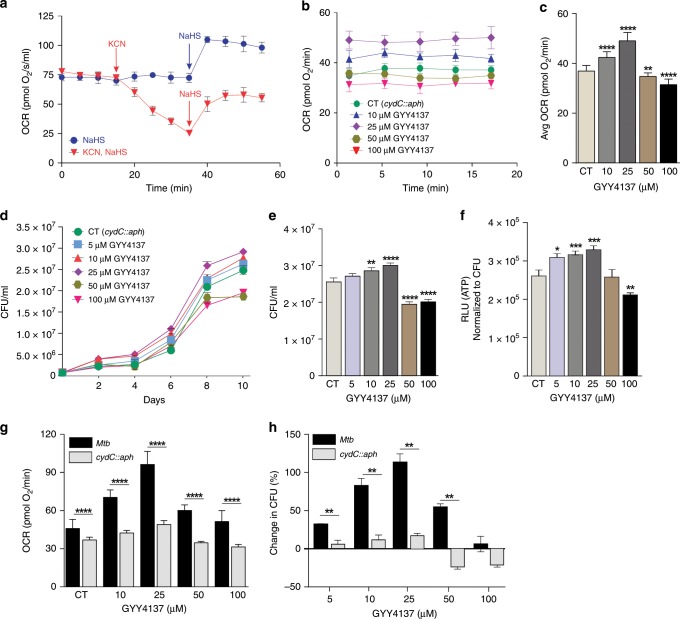
Fig. 4. H2S stimulates Mtb bioenergetics primarily through cytochrome bd-type quinol oxidase.
a Representative OCR profile of M. smegmatis (Msm) cells. Arrows indicate the time of addition of KCN (100 μM) or NaHS (25 μM) (n = 5). b Representative OCR profile and c average OCR of cydC::aph cells exposed to GYY4137 (n = 12−18, data pooled from at least two independent experiments). d CFU-based growth profile of cydC::aph cells following exposure to GYY4137. e Mean cydC::aph CFU values at day 10 of the growth analysis. f ATP levels in cydC::aph after 24 h exposure to GYY4137. Data (d−f) are representative of at least two independent experiments. g Comparison of the dose-dependent effect of GYY4137 on the OCR of Mtb and cydC::aph cells (from Figs. 2e and 4c). h Percent change in CFU of Mtb and cydC::aph (e) following exposure to increasing concentrations of GYY4137 (from Figs. 2b and 4e). The percent change was calculated against the CFU of control cells at day 10 following GYY4137 exposure. Data are shown as mean ± SD, except (e) (mean ± SEM). All comparisons are against control cells (CT) exposed to spent GYY4137 except in (g) and (h), which compare Mtb and cydC::aph at equivalent GYY4137 concentrations. Data were analyzed using two-way ANOVA (b, d) with Sidak’s multiple comparisons test, with average OCR (c) or CFU at day 10 (e). Other data were analyzed by one-way ANOVA with Sidak’s multiple comparisons test (f) or by using an unpaired parametric t test for comparisons at each GYY4137 concentration (g and h). *P < 0.05, **P < 0.01, ***P < 0.001, ****P < 0.0001. Source data are provided as a Source Data file.

